Appendix: Running on OpenShift (CRC) locally
The same seven-service data mesh, redeployed to OpenShift Local: a Helm chart, Security Context Constraints, Routes, and the integrated registry.
Chapter 3 built the case for Kubernetes as the mesh’s substrate and brought the capstone up on minikube via Helm — NodePorts published to loopback, a local image registry. That’s a real deployment, and everything in the reading set up to the summary assumes it. But “deploy it to Kubernetes” and “deploy it to OpenShift” are not the same sentence. OpenShift adds opinions on top of plain Kubernetes — Security Context Constraints that reject a pod demanding a specific UID, Routes instead of hand-rolled ingress, an integrated image registry with no external account — and those opinions are exactly what a chart has to be built around if it’s going to run there at all.
This appendix runs the same seven-service system — the GraphQL gateway, the six
data-product services, Postgres, Kafka, and Apicurio — on OpenShift Local (CRC), a
real single-node OpenShift cluster you run on a laptop. The implementation deck at
presentation/data-mesh-openshift/ already speaks OpenShift’s vocabulary in its
diagrams — Project for namespace, SCCs for pod security, OperatorHub/OLM for the
operator install path, AMQ Streams for Strimzi, CNPG for CloudNativePG — because the
deck was written to pair this reference with OpenShift specifically. This appendix is
what makes that pairing runnable: a Helm chart under
examples/lgtm-datamesh/openshift/helm/datamesh/,
built to the three constraints OpenShift imposes, plus the build/push/deploy sequence
that gets it running.
One scoping note up front, visible in the chart’s own Chart.yaml: this is the live
core of the capstone — the seven services, Postgres, Kafka, and Apicurio — not the
full minikube stack. OpenMetadata, Prefect, the LGTM observability stack, KEDA
autoscaling, and the Istio mesh are intentionally out of this chart by default. A
later section of this appendix, “The full platform tier, live,” brings all five of
those layers up on top of this same core as an opt-in addition — applied via
openshift/platform/install-platform.sh plus two chart flags
(mesh.enabled/observability.otlp.enabled) rather than baked into a plain helm
install — and reports what’s actually verified live for each, rather than just
documenting the OpenShift-native counterpart.
Prerequisites
You don’t need a paid subscription or a cloud account. OpenShift Local (CRC — “CodeReady Containers”) runs a real, single-node OpenShift cluster in a local VM.
This appendix uses podman (and oc) on the host to build and push to the integrated registry; the minikube path uses Docker Engine. Podman is needed only here.
- Create a free Red Hat Developer account. Go to developers.redhat.com, register or log in. It’s free and gives you access to OpenShift Local and the pull secret.
- Download OpenShift Local and its pull secret from
console.redhat.com/openshift/create/local:
the
crcbinary for your platform, and the pull secret (a small JSON file). Save the pull secret somewhere you can reference it, e.g.~/Downloads/pull-secret.txt. - Install
crc. Extract the archive and put thecrcbinary on yourPATH. This appendix was authored against CRC 2.64.0, which bundles OpenShift 4.22.14. -
Size the host. CRC’s defaults are not enough for seven Python services plus Postgres, Kafka, and Apicurio plus OpenShift’s own control plane — the infra pods will sit
PendingwithInsufficient memoryon the defaults, and the default disk will run intoDiskPressureonce the nine images in this appendix are pushed to the integrated registry (see “What broke on live apply” below). Give it more of all three, while the instance is still stopped — CRC can only grow disk size before the firstcrc start:crc config set memory 32768 # 32 GB crc config set cpus 14 crc config set disk-size 100 # 100 GBThis is the sizing the full platform tier actually needs — Istio sidecars on every app pod, the otel-lgtm observability backend, KEDA’s operands, and Prefect’s and OpenMetadata’s dependencies, all on top of the live core (see “The full platform tier, live” below, and DRA-008 in
_plans/decisions.md). If you only want the live core — the seven services, Postgres, Kafka, and Apicurio, with none of the platform tier applied — the smaller footprint this chart originally shipped with still works:crc config set memory 20480 # 20 GB — core only crc config set cpus 8 crc config set disk-size 80 # 80 GB — the default ~32 GB fills once 9 images are pushed -
Set it up and start it.
crc setup                                               # one-time; configures the VM + networking
crc start --pull-secret-file ~/Downloads/pull-secret.txt
crc setupneeds root for a couple of steps (a small setuid helper, the libvirt network), so run it wheresudocan prompt you. The firstcrc startprovisions the VM and waits for the cluster to settle — budget 10–15 minutes. When it finishes it prints thekubeadminconsole URL and credentials. -
Get
ocand log in. CRC ships a version-matchedoc;eval $(crc oc-env)puts it on yourPATH.eval $(crc oc-env) oc login -u kubeadmin -p <printed-password> https://api.crc.testing:6443Right after
crc startreturns, the API server can briefly reset connections while its operators roll out — ifoc loginfails withEOF, wait a minute and retry. - Install
helm(v3 or later). The chart has no other external dependencies — no operators are assumed to be pre-installed on the target cluster.
What changes when the target is OpenShift
The chart in openshift/helm/datamesh/ exists because three assumptions a plain
Kubernetes deployment makes do not survive contact with OpenShift.
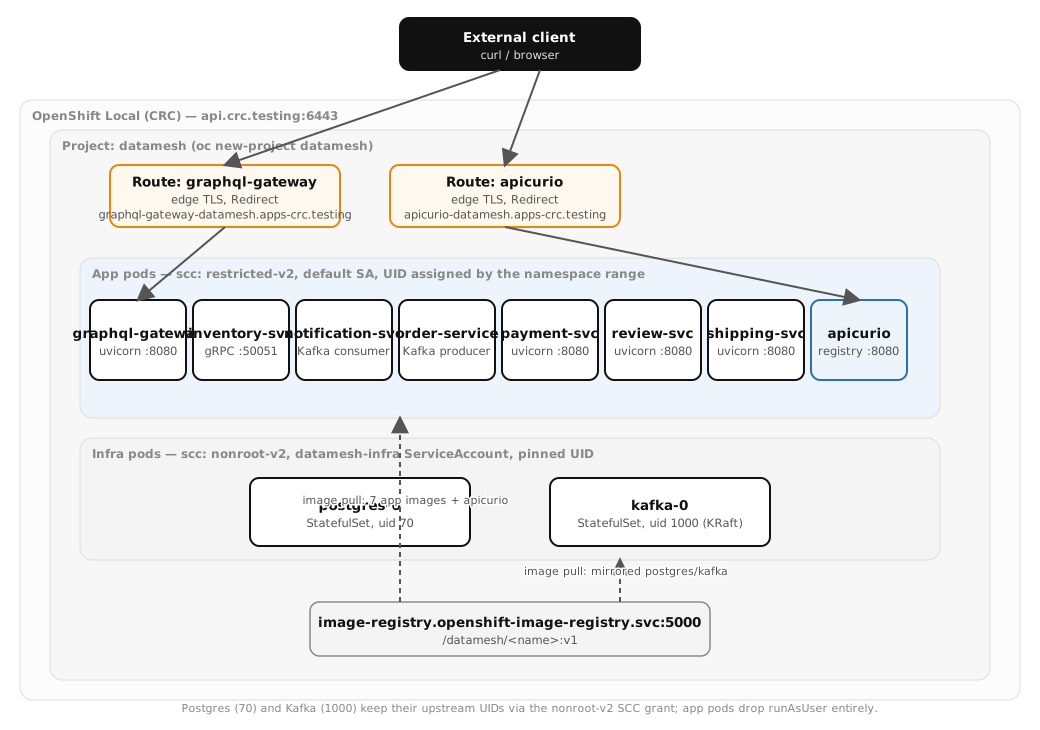
1. SCC/restricted-v2 rejects pinned UIDs
Every pod OpenShift admits is run through a Security Context Constraint (SCC). The
default, restricted-v2, assigns each pod a high UID from a per-namespace range and
rejects a pod that demands a specific one via runAsUser. A container built around
USER 1000 on plain Kubernetes, pinned in its Deployment spec, simply never admits on
OpenShift.
The seven Python services are built for exactly this. Their services/<svc>/Containerfile
images already declare USER 1001:0 — an arbitrary UID in group 0, with the
application’s files group-readable and group-writable — which is precisely what
restricted-v2 expects: it doesn’t care which UID a pod runs as, only that the pod
isn’t demanding one it assigned instead. So the fix for the app Deployments is to drop
runAsUser entirely and let OpenShift pick. templates/app-deployment.yaml sets
runAsNonRoot: true and nothing else UID-related — no runAsUser key appears anywhere
in the pod’s securityContext. Whatever UID restricted-v2 assigns, the image already
works under it.
Postgres and Kafka are the exception, and the chart treats them as one. Their upstream
images hardcode specific non-root UIDs that own their data directories — Postgres as
70, the Apache Kafka image as 1000 — so dropping runAsUser for them would be wrong:
whatever UID restricted-v2 assigned instead wouldn’t own /var/lib/postgresql/data or
/var/lib/kafka/data, and the containers would fail to start. For these two, the chart
grants an SCC that allows their UID instead of letting the default one assign a
different one. templates/serviceaccount-infra.yaml creates a ServiceAccount,
datamesh-infra, and binds it to the nonroot-v2 SCC; postgres.yaml and kafka.yaml
run their StatefulSets under that account with runAsUser: 70 and runAsUser: 1000
respectively, pinned explicitly, now legally.
The binding is the one piece of OpenShift RBAC worth internalizing on its own: OpenShift
auto-generates a ClusterRole named system:openshift:scc:<scc-name> for every SCC on the
cluster, whose single permission is “use this SCC.” Binding a ServiceAccount to that
ClusterRole via a RoleBinding is what grants the SCC — there’s no separate “SCC
assignment” API, it’s ordinary RBAC pointed at a cluster-generated role:
apiVersion: rbac.authorization.k8s.io/v1
kind: RoleBinding
metadata:
  name: {{ .Values.infra.serviceAccountName }}-scc
roleRef:
  apiGroup: rbac.authorization.k8s.io
  kind: ClusterRole
  name: system:openshift:scc:{{ .Values.infra.scc }}
subjects:
  - kind: ServiceAccount
    name: {{ .Values.infra.serviceAccountName }}
    namespace: {{ .Release.Namespace }}
The CLI shorthand for the same grant is oc adm policy add-scc-to-user nonroot-v2 -z
datamesh-infra, which is worth knowing when debugging a pod stuck in
CreateContainerConfigError with an SCC-related event — it’s the same RoleBinding under
the hood.
2. Routes, not published NodePorts
The minikube path this capstone uses elsewhere in the reading set exposes services via
NodePorts published to 127.0.0.1 when the profile is created, because minikube has no
cluster-native router. OpenShift has one built in: a Route object hands a Service a
real external hostname, served by the cluster’s router, with nothing to publish on the
host. The chart defines two —
templates/route.yaml ranges over the same services: map and emits a Route for any
service with route: true set (currently just graphql-gateway), and apicurio.yaml
wires its own Route directly since Apicurio isn’t part of that map:
graphql-gateway   graphql-gateway-datamesh.apps-crc.testing   edge/Redirect
apicurio          apicurio-datamesh.apps-crc.testing          edge/Redirect
edge/Redirect means TLS terminates at the router and plain HTTP is redirected to
HTTPS — no certificate handling in the application at all. Every other service
(inventory-service, order-service, the rest) stays ClusterIP-only, reachable in-cluster
but with no Route, exactly as it would on minikube without a NodePort.
3. The integrated registry
OpenShift runs its own image registry inside the cluster, addressed in-cluster by its
Service DNS: image-registry.openshift-image-registry.svc:5000. values.yaml’s
image.registry points there by default. No external registry account, and no
Docker-Hub-style push credentials, are required for a local cluster — the only
credential involved is an oc whoami -t token used to podman login to the registry’s
external route when you need to push from outside the cluster, which the build step
below does.
The chart: one data-driven template, seven services
The chart does not carry seven near-identical Deployment manifests. It carries one,
templates/app-deployment.yaml, and describes the seven workloads as data in
values.yaml:
services:
  graphql-gateway:
    port: 8080
    probe: http
    size: small
    route: true
  inventory-service:
    port: 8080
    grpcPort: 50051
    probe: http
    size: large
    db: inventory
  notification-service:
    port: 8080
    probe: http
    size: large
    db: notifications
    kafka: true          # Kafka consumer (order-placed) → graceful-shutdown window
    migrate: true         # Alembic `upgrade head` init container
  order-service:
    port: 8080
    probe: http
    size: large
    db: orders
    kafka: true           # Kafka producer (order-placed)
  # payment-service, review-service, shipping-service follow the same shape
Each key captures only what differs between services: its port (all seven are uvicorn
on :8080), whether it exposes a second gRPC port (inventory-service’s :50051),
whether it owns a Postgres schema, whether it’s a Kafka participant needing a graceful
shutdown window, whether it needs an Alembic migration init container ahead of the app
container, and its resource tier. templates/app-deployment.yaml then ranges over that
map once, and the interesting part is the conditionals built from it — this is where
“the template is driven by data” earns its keep:
{{- range $name, $svc := .Values.services }}
    spec:
      {{- if $svc.kafka }}
      terminationGracePeriodSeconds: 45     # let in-flight records send/commit
      {{- end }}
      containers:
        - name: {{ $name }}
          image: "{{ $root.Values.image.registry }}/{{ $name }}:{{ $root.Values.image.tag }}"
          {{- if $svc.grpcPort }}
          ports:
            - name: grpc
              containerPort: {{ $svc.grpcPort }}
          {{- end }}
          {{- if eq $svc.probe "http" }}
          readinessProbe:
            httpGet: { path: /healthz, port: http }
          {{- else }}
          readinessProbe:
            tcpSocket: { port: http }
          {{- end }}
          securityContext:
            runAsNonRoot: true            # NOTE: no runAsUser — restricted-v2 assigns it
            allowPrivilegeEscalation: false
            capabilities: { drop: ["ALL"] }
            seccompProfile: { type: RuntimeDefault }
{{- end }}
Every service in this system ships /health as its liveness check and /healthz as its
readiness check — all seven are probe: http in practice, but the conditional exists
because the chart is carried over from a sibling project where some services shipped
without a health-check library and needed a bare TCP probe instead; it costs nothing to
keep the branch here even though every current service takes the http path.
notification-service adds one more wrinkle worth calling out: migrate: true adds an
initContainer running alembic upgrade head against the same database before the
uvicorn container starts, so the schema exists before the app issues a single query —
no CREATE TABLE happens on the hot path.
The shared environment contract — the Kafka bootstrap address, the Apicurio URL, the
gRPC coordinate for inventory-service, the gateway’s downstream REST URL — is one
ConfigMap, templates/configmap-app.yaml. The one detail worth noting is that every
in-cluster address it builds is namespace-relative:
data:
  KAFKA_BOOTSTRAP: "kafka.{{ .Release.Namespace }}.svc.cluster.local:9092"
  APICURIO_URL: "http://apicurio.{{ .Release.Namespace }}.svc.cluster.local:8080"
  INVENTORY_GRPC_ADDR: "inventory-service.{{ .Release.Namespace }}.svc.cluster.local:50051"
so the chart installs cleanly into any namespace — datamesh, as this appendix does, or
anything else — without a single hardcoded string to edit.
Postgres and Kafka are plain StatefulSets, not operator-managed CRs — templates/postgres.yaml
and templates/kafka.yaml don’t assume the CloudNativePG or Strimzi operators are
installed on the target cluster, since this is meant to run on a bare CRC instance with
nothing pre-installed beyond OpenShift itself. Kafka runs single-broker KRaft (no
ZooKeeper), self-referencing its own pod-stable DNS (kafka-0.kafka.<ns>.svc...:9093) as
its quorum voter, with publishNotReadyAddresses: true on its headless Service — a
single-node KRaft broker has to resolve its own controller address to become ready in
the first place, so the Service has to advertise it before it’s marked ready. Both
StatefulSets run under datamesh-infra with fsGroup set to match their UID, so their
PersistentVolumeClaims are writable from the first mount.
Building and pushing the images
The seven services each ship a services/<svc>/Containerfile. openshift/build-and-push.sh
builds and pushes all seven to the internal registry, after you expose its default route
and log podman in:
oc patch configs.imageregistry.operator.openshift.io/cluster \
  --type merge -p '{"spec":{"defaultRoute":true}}'
REG=$(oc get route default-route -n openshift-image-registry -o jsonpath='{.spec.host}')
podman login -u "$(oc whoami)" -p "$(oc whoami -t)" --tls-verify=false "$REG"

oc new-project datamesh
./openshift/build-and-push.sh -r "$REG" -n datamesh
The script loops podman build over each services/<svc>/Containerfile, then tags and
pushes to $REG/datamesh/<svc>:v1 — exactly the reference values.yaml’s
image.registry/image.tag compose, so a plain helm upgrade --install finds the
images with no further wiring. Pushing auto-creates an ImageStream per image in the
namespace, which is how the internal registry tracks what it’s holding.
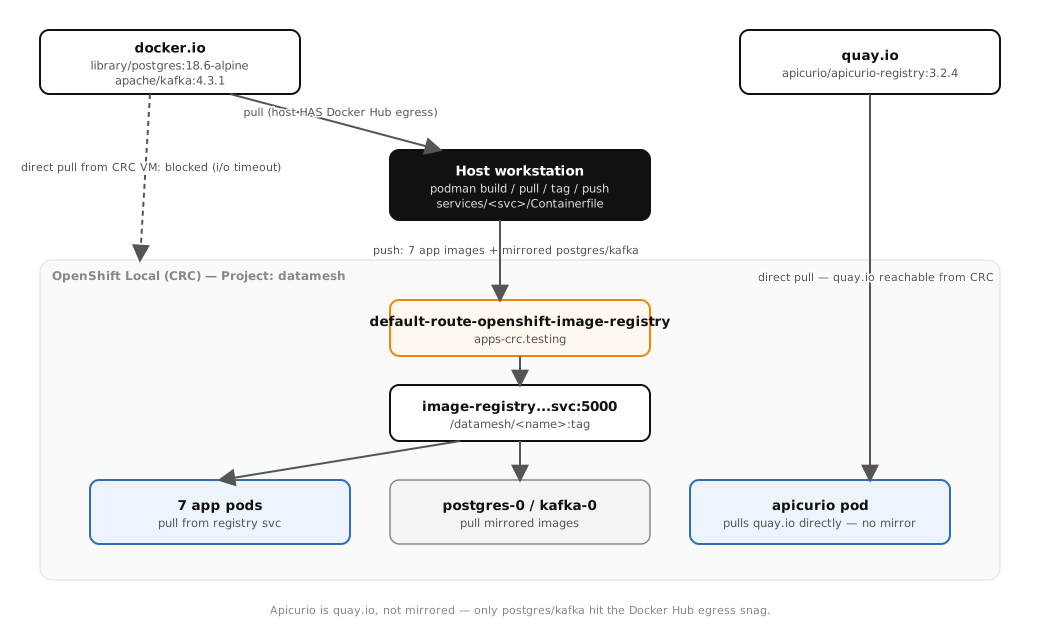
One real snag worth planning for. The CRC VM’s outbound networking does not
necessarily reach Docker Hub — a direct podman pull docker.io/library/postgres:18.6-alpine
run inside the cluster’s image-pull path can fail with something like dial tcp
registry-1.docker.io:443: i/o timeout, which shows up as postgres-0/kafka-0 stuck in
ImagePullBackOff after helm install. The host running podman/oc, by contrast,
usually has ordinary internet access. The fix is to mirror the two upstream images
through the host into the internal registry, rather than letting the cluster pull them
directly:
./openshift/build-and-push.sh -r "$REG" -n datamesh --mirror-infra
which pulls docker.io/library/postgres:18.6-alpine and docker.io/apache/kafka:4.3.1 on
the host, retags them into $REG/datamesh/postgres:18.6-alpine and
$REG/datamesh/kafka:4.3.1, and pushes — exactly the refs values.yaml’s
postgres.image/kafka.image default to. On a cluster whose CRC VM does have Docker
Hub egress, skip --mirror-infra and uncomment the commented upstream docker.io/...
lines in values.yaml instead; both forms are left in the file, one active.
Apicurio needs no such mirror: its image lives on quay.io
(quay.io/apicurio/apicurio-registry:3.3.3), which CRC’s networking reaches directly, so
apicurio.yaml’s Deployment references it unmirrored.
Deploying, and watching it come up
oc new-project datamesh   # skip if you already created it above
helm upgrade --install datamesh openshift/helm/datamesh --namespace datamesh
oc get pods -n datamesh -w
NAME                                    READY   STATUS    RESTARTS        AGE
apicurio-b8496b8d4-gsqxz                1/1     Running   0               12m
graphql-gateway-7b4b45db4b-pb86w        1/1     Running   0               12m
inventory-service-86bd746bb9-5gsr7      1/1     Running   2 (2m51s ago)   12m
kafka-0                                 1/1     Running   0               12m
notification-service-78c57864b8-rsh9g   1/1     Running   0               12m
order-service-5b6b895cf8-lsgsc          1/1     Running   0               12m
payment-service-7666685477-4cxsv        1/1     Running   3 (3m2s ago)    12m
postgres-0                              1/1     Running   0               12m
review-service-64fc9f7c5f-9gjml         1/1     Running   3 (3m7s ago)    12m
shipping-service-c8c94685b-vzs8l        1/1     Running   3 (2m58s ago)   12m
That’s the live run, twelve minutes after helm upgrade --install: all ten workloads
1/1. The 2–3 restarts on inventory-service, payment-service, review-service, and
shipping-service are exactly the convergence described above, not a defect —
those four happened to lose the race against postgres-0 reaching Ready on this
particular run; graphql-gateway, order-service, and notification-service happened
to win it. Re-running the same helm install against a fresh crc start will likely
distribute the restarts across a different subset of services — which four crash-loop
is a function of scheduling order and Postgres’s own startup time, not something the
chart controls or needs to.
Expect the app pods to crash-loop before the infrastructure is ready, and expect
that to be fine. notification-service’s migrate init container, and every service’s
database connection on first boot, depend on Postgres and Kafka already being reachable.
A pod that starts before its StatefulSet dependency is Ready fails fast — a DNS lookup
with no ready endpoints behind it, then connection refused — and restarts on the normal
back-off schedule. As postgres-0 and kafka-0 reach 1/1, each service recovers on
its next attempt. The restart counts you see in oc get pods are the scar tissue of that
ordering, not a sign anything is actually broken; the end state is all green regardless
of how many restarts it took to get there. (If you want a clean start with no restart
churn, install the infra StatefulSets’ templates first and wait for them before letting
the app Deployments roll out — but the self-healing path above is what a plain helm
install does, and it converges on its own.)
If you skipped the memory bump in the prerequisites, the infra pods sit Pending
instead — oc describe pod postgres-0 reports Insufficient memory, and oc describe
node’s “Allocated resources” section shows memory requests near 100%. Stop the cluster,
raise crc config set memory, and crc start again; the pods schedule once there’s
room.
Verifying it works
Health, through the GraphQL gateway’s Route (edge TLS):
curl -sk https://$(oc get route graphql-gateway -n datamesh -o jsonpath='{.spec.host}')/healthz
$ curl -sk https://graphql-gateway-datamesh.apps-crc.testing/healthz
{"status":"ready","service":"graphql-gateway"}
And a real query through the gateway spanning two or more of the underlying products —
the point of a GraphQL gateway is composing reads across services the caller never talks
to directly, so the query worth running is one that can only succeed if that composition
actually works, for example an order placed through order-service with its live stock
level attached from inventory-service:
curl -sk https://$(oc get route graphql-gateway -n datamesh -o jsonpath='{.spec.host}')/graphql \
  -H 'content-type: application/json' \
  -d '{"query":"{ order(id: \"6c5a7fb2-a9d6-44dd-bbe1-eef95c5bdb5e\") { id customerId itemSku quantity status amount stock { sku quantityOnHand available } } }"}'
{"data": {"order": {"id": "6c5a7fb2-a9d6-44dd-bbe1-eef95c5bdb5e", "customerId": "cust-openshift", "itemSku": "WIDGET-001", "quantity": 2, "status": "placed", "amount": "19.98", "stock": {"sku": "WIDGET-001", "quantityOnHand": 50, "available": true}}}}
The top-level order fields — customerId, itemSku, quantity, status, amount —
come straight from order-service’s own Postgres row; the nested stock object is a
second, independent hop the gateway makes over gRPC to inventory-service’s :50051
port to resolve quantityOnHand/available for that same SKU. A 200 with both halves
populated — the order half and the stock half — confirms the Route, the SCC-assigned
UID, the ConfigMap wiring (INVENTORY_GRPC_ADDR), and the gateway’s REST-plus-gRPC
fan-out to two independent services are all working together, not just that one pod
answers its own health check.
The same placed order also proves out the event-driven path end to end, off the Route
entirely: order-service publishes an Avro-encoded order.placed event (schema
registered in Apicurio) to Kafka when the order above was created, and
notification-service consumed it, Apicurio-deserialized it, and exposed the decoded
record on its own debug endpoint:
$ curl notification-service:8080/received
[{"order_id": "6c5a7fb2-a9d6-44dd-bbe1-eef95c5bdb5e", "event_type": "order.placed", "customer_id": "cust-openshift", "item_sku": "WIDGET-001", "quantity": 2, "amount": "19.98", "status": "OrderStatus.placed", "created_at": "2026-10-07T16:20:12.074293+00:00"}]
Same order ID, same SKU, same quantity — one order.placed write landed through two
independent consumers of the mesh: the GraphQL gateway’s synchronous read path above,
and Kafka’s asynchronous one. Together the two checks exercise everything the live-core
chart wires up — Route → REST → gRPC on one side, Route-independent Kafka
produce/consume with schema-registry-backed Avro on the other — independent of the
platform tier described below.
What broke on live apply
Two things went wrong on the actual run against CRC, neither in the chart’s design — both in the tooling around it — plus one thing worth stating plainly because it did not break: the SCC assignment this appendix spent most of its length justifying.
1. All ten pods stuck Pending behind a disk-pressure taint. Partway through
helm upgrade --install, every pod sat Pending with a
node.kubernetes.io/disk-pressure:NoSchedule taint and no obvious resource request
problem — oc describe node wasn’t short on memory or CPU. The cause was the registry
push that happens just before deployment: build-and-push.sh had already pushed all
nine images (seven app images plus the mirrored postgres/kafka infra images) into
the integrated registry, and that registry’s storage lives on the CRC node’s own disk.
CRC’s default VM disk is a modest ~32 GB, and nine images pushed into it was enough
to cross the kubelet’s disk-pressure eviction threshold (27 GB used on a 32 GB disk).
Once a node is under DiskPressure, the scheduler taints it and nothing new schedules —
not a Kubernetes misconfiguration, just the VM running out of room for what this chart
actually ships. The fix is the same host-sizing move as the memory and CPU bump in the
prerequisites, just for disk:
crc stop
crc config set disk-size 80
crc start --pull-secret-file ~/Downloads/pull-secret.txt
After the restart the taint cleared and all ten pods scheduled and converged to 1/1
on their own — this appendix’s prerequisites section above already reflects the 80
value for exactly this reason; a reader following it from a stopped state should never
hit the taint in the first place. (This is also why crc config set disk-size is worth
setting before the first crc start rather than discovering it mid-deploy: CRC disk
size can only be grown while the instance is stopped.)
2. build-and-push.sh exited 2 after every image had already pushed. The script’s
final step prints a one-line hint for the --mirror-infra flag described earlier in
this appendix. That hint line is passed to printf with a leading --mirror-infra ...
string, which printf parses as an option flag rather than a format string — an exit
code 2 with no images actually affected, since the build-and-push loop itself had
already completed and returned before the hint line ran. The fix is the standard
printf-no-longer-takes-flags-after-this idiom, printf -- '%s\n' "...", which forces
everything after -- to be treated as data. Purely cosmetic: by the time the script
exits non-zero, the registry already has all nine images, which oc get istag -n
datamesh confirms independent of the script’s own exit status.
What didn’t break: the SCC assignment. The entire premise of the “what changes on
OpenShift” section above — drop runAsUser for the seven Python app images and let
restricted-v2 assign a UID, pin runAsUser for Postgres and Kafka under a
datamesh-infra ServiceAccount bound to nonroot-v2 — held exactly as designed on the
first deploy, no iteration needed. The live SCC/UID table earlier in this appendix is
the proof: all seven app pods landed on restricted-v2 with the same OpenShift-assigned
UID, 1000650000 (the images’ USER 1001:0 made them agnostic to whichever UID that
turned out to be), while postgres-0 kept its required 70 and kafka-0 its required
1000, both legally, both under nonroot-v2 via the datamesh-infra RoleBinding. The
two breakages above were the registry-storage footprint and a shell quoting bug — not
the admission model this appendix is actually about.
The full platform tier, live
The live core above is the Helm chart’s whole job — but this appendix also brings up
the five layers that chart deliberately leaves out, as an opt-in platform tier on
top of that same core. None of this changes the core’s default behavior: a plain helm
upgrade --install datamesh openshift/helm/datamesh still renders exactly the chart
described above, with no mesh labels and no OTEL environment variables anywhere in it —
both mesh.enabled and observability.otlp.enabled default to false in
values.yaml. The platform tier only appears once you additionally run
openshift/platform/install-platform.sh
and flip those two flags on (helm upgrade --set mesh.enabled=true --set
observability.otlp.enabled=true).
Four of the five layers below are verified live against the resized CRC instance from
the prerequisites. The fifth, OpenMetadata, is best-effort and partial — read that
subsection carefully before treating it as done. The full capture for each layer is
committed under
examples/lgtm-datamesh/openshift/evidence/.
Service mesh: OpenShift Service Mesh 3 (Sail operator), Istio v1.30
Chapter 6 runs Istio
directly on minikube, labeling the whole namespace for injection. OpenShift’s mesh is
OpenShift Service Mesh 3 (OSSM3), Red Hat’s Sail-operator-based distribution:
openshift/platform/mesh/istio.yaml and istio-cni.yaml install it as an Istio CR
plus a matching IstioCNI CR, not a raw istioctl install. Injection is a
pod-template LABEL, istio.io/rev, set on the seven app Deployments (and the
order-service canary) behind the chart’s mesh.enabled flag — Sail’s revisioned
injection webhook doesn’t reliably fire on the classic sidecar.istio.io/inject
annotation the minikube overlay uses. Postgres, Kafka, and Apicurio stay unlabeled,
unmeshed infrastructure, which is exactly what the live sidecar counts show: the seven
app pods carry 2/2 (app container plus Envoy), the three infra pods stay 1/1.
Namespace-wide mTLS is STRICT — a PeerAuthentication named default — with one
scoped exception: a second PeerAuthentication, graphql-gateway-permissive, sets
PERMISSIVE for just the gateway. The OpenShift Route fronting the gateway is not
mesh-aware and arrives as plaintext, and STRICT namespace-wide rejected that edge
traffic outright (502s from the Route) before the gateway-scoped exception was carved
out — the live lesson behind this appendix’s newest decision entry. Every other hop in
the mesh — service to service, all mesh-internal — stays STRICT.
The v1/v2 canary itself runs as a mesh-internal VirtualService/DestinationRule
rather than through an Istio ingress gateway: OSSM3 provisions no default ingress
gateway the way istioctl’s default profile does, and the edge is already the
OpenShift Route, so the weighted split applies to sidecar-to-sidecar traffic instead of
external ingress. Over 30 requests to order-service, the observed split against the
configured 90/10 VirtualService weights was v1=26, v2=4.
(Evidence: examples/lgtm-datamesh/openshift/evidence/mesh-verification.txt.)
Autoscaling: Custom Metrics Autoscaler (Red Hat’s KEDA distribution)
Chapter 7 scales
notification-service to zero on Kafka consumer lag using core KEDA on minikube.
OpenShift’s supported path packages the same KEDA API as the Custom Metrics
Autoscaler operator: openshift/platform/keda/kedacontroller.yaml stands up a
KedaController operand, and notification-scaledobject.yaml ports the Kafka
consumer-lag ScaledObject for notification-service against topic order-placed.
The full scale cycle was observed live: idle at zero replicas (minReplicaCount: 0) →
a burst of 12 orders drove the ScaledObject to Active=True and scaled 0→1 within
~15 seconds → the backlog drained, Active returned to False → a roughly 90-second
cooldown scaled it back 1→0. The KEDA HTTP add-on that scales graphql-gateway on
minikube is not part of the Custom Metrics Autoscaler — CMA ships core KEDA only —
so gateway HTTP-request scale-to-zero was dropped on OpenShift; there’s no drop-in CMA
equivalent for it.
(Evidence: examples/lgtm-datamesh/openshift/evidence/keda-verification.txt.)
Observability: grafana/otel-lgtm, running as root under anyuid
Chapter 8 stands up the full split
Loki/Grafana/Tempo/Mimir stack on minikube. This appendix instead deploys the
single-container grafana/otel-lgtm all-in-one image
(openshift/platform/observability/lgtm-deployment.yaml) — Collector, Tempo, Loki,
Mimir, and Grafana in one Deployment — and re-enables OTLP export from the services via
the chart’s observability.otlp.enabled flag, scoped to traces only
(OTEL_METRICS_EXPORTER=none keeps metrics load off a single-replica backend).
The real lesson here was admission, not the image. The otel-lgtm image owns its data
directories as UID 0, so its pod needs runAsUser: 0, which forces it onto the
anyuid SCC via a dedicated lgtm ServiceAccount — restricted-v2 rejects root
outright. The non-obvious part: adding a seccompProfile or capabilities block to
that same securityContext — the kind of change that reads as pure hardening — makes
anyuid reject the pod instead of admitting it, because its allowed
seccomp-profile list is empty. That rejection doesn’t surface as a loud SCC-denial
event; it silently drops the pod back onto restricted-v2’s randomly assigned UID,
where Grafana can’t write /data and the pod hangs forever at “Waiting for Grafana to
start up…”, with nothing pointing at the real cause. runAsUser: 0 alone — no
seccompProfile, no capabilities — is what anyuid actually wants.
Live, Grafana reports healthy through its Route ("database": "ok"), and Tempo is
ingesting per-service traces: graphql-gateway, order-service, inventory-service,
and notification-service each produced recent traces during the capture window
(payment-service produced none in that window).
Honest limit, stated plainly: those are per-service traces, not one stitched
cross-service trace. The gateway’s downstream HTTP/gRPC calls don’t propagate a W3C
traceparent header, so each service roots its own trace instead of continuing the
caller’s — an application-instrumentation gap, not something OpenShift or the mesh
fails to do. Envoy’s own mesh spans hit the same ceiling: they can’t correlate across
hops without the application propagating that header either.
(Evidence: examples/lgtm-datamesh/openshift/evidence/observability-verification.txt.)
Orchestration: Prefect 3.x, server and worker on the core Postgres
Prefect’s server and worker (openshift/platform/prefect/server-deployment.yaml,
worker-deployment.yaml) reuse the core postgres StatefulSet via a dedicated
prefect database and login role, rather than bundling a second Postgres instance —
this chart’s established one-Postgres-per-cluster convention.
Live, the server’s /api/health returned true through its Route, and the example
two-task flow (datamesh-example-flow) ran end to end against the server API: both the
say_hello and say_goodbye tasks, and the flow run itself (zircon-waxbill), reached
COMPLETED, confirmed via /api/flow_runs/filter.
(Evidence: examples/lgtm-datamesh/openshift/evidence/prefect-verification.txt.)
Catalog: OpenMetadata — best-effort, partial
Chapter 4 uses OpenMetadata on minikube. The OpenShift port is the same tool, retargeted to this chart’s Postgres for its backend database and a single-node OpenSearch for search — and it is the one layer in this platform tier that is not fully verified live.
What’s live: OpenSearch came up green (single node, confirmed against its own
:9200/_cluster/health endpoint) once its pod was bound to a dedicated
openmetadata-opensearch ServiceAccount granted the anyuid SCC. That fixed-UID/
fsGroup admission gate was the hard part of this whole layer, and it’s solved: the
openmetadata database and role are provisioned in the core Postgres, and the
Secrets/SCC wiring the OM server needs is in place.
What’s blocked, and why it isn’t a deployment defect: the OpenMetadata server image
(docker.getcollate.io/openmetadata/server:1.12.8) fails to pull —
ImagePullBackOff, toomanyrequests: unauthenticated pull rate limit — against Docker
Hub, from both the CRC VM and the host directly. That’s an external quota, not a
problem with the chart, the database wiring, or the SCC grant: the two unblock paths are
authenticating to Docker Hub (podman login docker.io) before mirroring the image into
the internal registry, or waiting out the rate-limit reset window (roughly six hours);
neither was exercised for this verification pass. The distinction matters if you
reproduce this yourself — the hard problem (SCC admission for a fixed-UID,
fsGroup-dependent dependency) is solved; an unrelated external rate limit is what’s
still standing between this layer and a running OM server.
(Evidence: examples/lgtm-datamesh/openshift/evidence/openmetadata-verification.txt.)
GitOps and Pipelines: the managed counterpart
Everything above is imperative: you ran helm upgrade --install by hand. The
OpenShift-native way to keep a cluster matching the chart is OpenShift GitOps
(Argo CD) — an Application object points at the chart in this repo, and Argo
continuously reconciles the cluster to it, pruning drift and self-healing. A starter
manifest is committed at
openshift/gitops/application.yaml:
apiVersion: argoproj.io/v1alpha1
kind: Application
metadata:
  name: datamesh
  namespace: openshift-gitops
spec:
  source:
    repoURL: https://github.com/patterncatalyst/datamesh-reference-arch-python.git
    targetRevision: main
    path: examples/lgtm-datamesh/openshift/helm/datamesh
  destination:
    server: https://kubernetes.default.svc
    namespace: datamesh
  syncPolicy:
    automated: { prune: true, selfHeal: true }
Its symmetric partner on the build side is OpenShift Pipelines (Tekton): the
podman build/push loop in build-and-push.sh becomes a Pipeline triggered on
push, so a commit to a service’s source produces a new image in the internal registry
without a human running the script. Both are deliberately left as starting points rather
than part of the verified deploy in this appendix — each needs its operator installed
(OpenShift GitOps, OpenShift Pipelines), and GitOps additionally needs this repo
reachable from the cluster. Neither was applied for this appendix’s verification pass.
*Verification status: verified live, 2026-10-07, on OpenShift Local (CRC 2.64.0, OpenShift 4.22.14, single node). Two tiers were verified on this date, at the two host sizings in the prerequisites’ “Size the host” step.
Live core (20 GB RAM / 8 vCPU / 80 GB disk; helm upgrade --install datamesh
openshift/helm/datamesh --namespace datamesh, both platform flags left at their
false default). All ten workloads — the seven application Deployments, Apicurio, and
the Postgres and Kafka StatefulSets — reached 1/1 Running in Project datamesh. SCC
behavior was confirmed by reading each pod’s effective SCC and runtime UID: the seven
app pods under restricted-v2 with OpenShift-assigned UID 1000650000, postgres-0
under nonroot-v2 with UID 70, and kafka-0 under nonroot-v2 with UID 1000, both
infra pods running under the datamesh-infra ServiceAccount. The GraphQL gateway’s
Route returned {"status":"ready","service":"graphql-gateway"} from /healthz, and a
cross-service /graphql query through that same Route returned a populated order
object from order-service joined to a populated stock object resolved over gRPC
from inventory-service — the Route, the SCC-assigned UID, the ConfigMap wiring, and
the gateway’s REST-plus-gRPC fan-out, all exercised together. The Kafka path was
confirmed independently: the same order’s order.placed event, Avro-encoded against
the Apicurio schema registry, was observed decoded on notification-service’s own
endpoint. The full capture is committed at
examples/lgtm-datamesh/openshift/evidence/verification.txt.
Full platform tier (32 GB RAM / 14 vCPU / 100 GB disk; the same live core plus
openshift/platform/install-platform.sh and mesh.enabled=true /
observability.otlp.enabled=true):
- Service mesh — OSSM3/Sail, Istio v1.30: the seven app pods report
2/2(app container plus Envoy sidecar) against the three infra pods’1/1; namespace-widePeerAuthenticationSTRICTwith agraphql-gateway-permissivePERMISSIVEexception so the non-mesh OpenShift Route still reaches the edge; the order-service v1/v2 canary (mesh-internalVirtualService, no ingress gateway) split 26/4 over 30 requests against a 90/10 configured weight. (examples/lgtm-datamesh/openshift/evidence/mesh-verification.txt) - Autoscaling — Custom Metrics Autoscaler: the
notification-service-scalerScaledObjectdemonstrated the full cycle live — idle at zero replicas, scaled 0→1 within ~15s of a 12-order burst raising Kafka consumer lag, back to 0 after a ~90s cooldown once the backlog cleared. (examples/lgtm-datamesh/openshift/evidence/keda-verification.txt) - Observability — grafana/otel-lgtm all-in-one under the
anyuidSCC, root with no seccomp profile or capabilities (see DRA-016): Grafana reports"database": "ok"through its Route, and Tempo is ingesting per-service traces fromgraphql-gateway,order-service,inventory-service, andnotification-service. (examples/lgtm-datamesh/openshift/evidence/observability-verification.txt) - Orchestration — Prefect 3.x server and worker on the core Postgres:
/api/healthreturnedtruethrough its Route, and the example flow run (zircon-waxbill,datamesh-example-flow) reachedCOMPLETED. (examples/lgtm-datamesh/openshift/evidence/prefect-verification.txt) - Catalog (OpenMetadata) — partial/best-effort, not fully verified: OpenSearch
reached
greenunder a dedicatedanyuid-bound ServiceAccount — the fixed-UID/ fsGroup SCC gate, the hard part, is solved — while the OpenMetadata server itself is blocked by an external Docker Hub unauthenticated pull-rate limit (toomanyrequests), not a deployment defect: the chart, database wiring, and SCC grant are all in place and simply unproven because the server image never pulled. (examples/lgtm-datamesh/openshift/evidence/openmetadata-verification.txt)
Honest limits, carried forward:
- Observability’s per-service traces are not stitched into one cross-service
trace — the services don’t propagate a W3C
traceparentheader across their HTTP/gRPC calls, an application-instrumentation gap, not an OpenShift or mesh limitation. - OpenMetadata’s server component remains unverified live, blocked on an external registry quota rather than anything this build controls.
- The verification above ran on the appendix’s earlier image pins
(
postgres:16-alpine,kafka:3.8.0, Apicurio 3.2.4, otel-lgtm 0.8.1, Prefect3-latest, OpenMetadata 1.12.8). On 2026-10-09 the pins moved to the newest stable tags (postgres:18.6-alpine,kafka:4.3.1, Apicurio 3.3.3, otel-lgtm 0.36.0, Prefect 3.8.8-python3.14, OpenMetadata 2.0.5 with OpenSearch 3.4.0; DRA-020); they have not been run on CRC yet. Postgres 18 cannot open a 16 data directory, so an existing install needs a fresh PVC. The operator CSVs (Service Mesh 3, Custom Metrics Autoscaler) and the OSSM3 Istio version can’t be resolved without a cluster; they are re-checked at the next CRC run. - OpenShift GitOps (the
Applicationatopenshift/gitops/application.yaml) and OpenShift Pipelines (Tekton) remain authored, not applied — no operators for either were installed for either verification pass.
Re-confirm the live core by re-running helm upgrade --install against a fresh crc
start, then re-driving the two Route curls and re-reading each pod’s SCC annotation —
the assigned app UID will differ per cluster, but the SCC names, the infra UIDs, and the
200s should not. Re-confirm the platform tier by re-running install-platform.sh on
top of a resized instance and re-capturing the same evidence files under
examples/lgtm-datamesh/openshift/evidence/.*