Observability
Seeing what the mesh is doing — metrics, distributed traces across products, and the live view of traffic between them.
The previous page ended on scaling and recovery — the platform doing things automatically in response to demand and failure. But “the platform does things automatically” is only reassuring if you can see it happening. This page is about observability: the metrics that show a product’s load and the autoscaler’s response, the distributed traces that follow a single request across several products, and the live view of traffic moving through the mesh. In a system of independently-owned products talking to each other, observability isn’t a dashboard you add at the end — it’s how anyone understands behavior that no single product fully contains.
The three signals, and why a mesh needs all of them
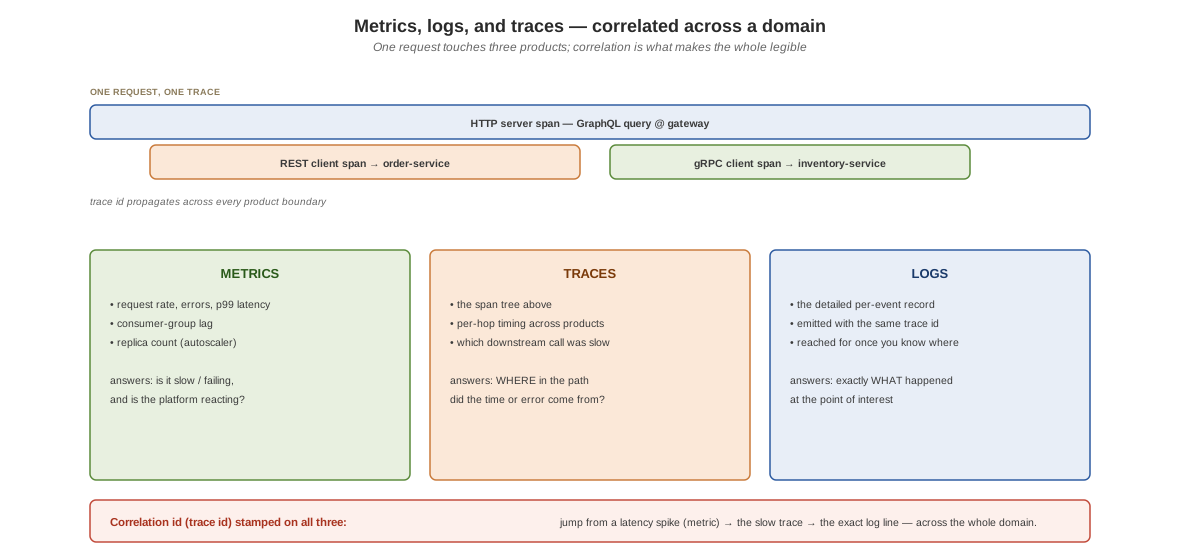
Observability conventionally rests on three kinds of signal, and a data mesh has a distinct use for each. Metrics are aggregate numbers over time — request rates, error rates, consumer lag, replica counts — and they’re what show you that the autoscaler woke the gateway, or that one product’s error rate is climbing. Traces follow a single request as it crosses product boundaries, so you can see that a slow GraphQL query was slow because the gRPC call it made downstream was slow — something no single product’s own logs would reveal. Logs are the detailed per-event record you reach for once metrics and traces have told you where to look.
The reason a mesh needs all three, rather than just per-service logs, is that the interesting behavior lives between products. A request that touches the gateway, an order service, and an inventory service is a single user-facing operation spread across three independently-owned products; understanding it means correlating signals that no one product owns in full.
Metrics, for free from the mesh
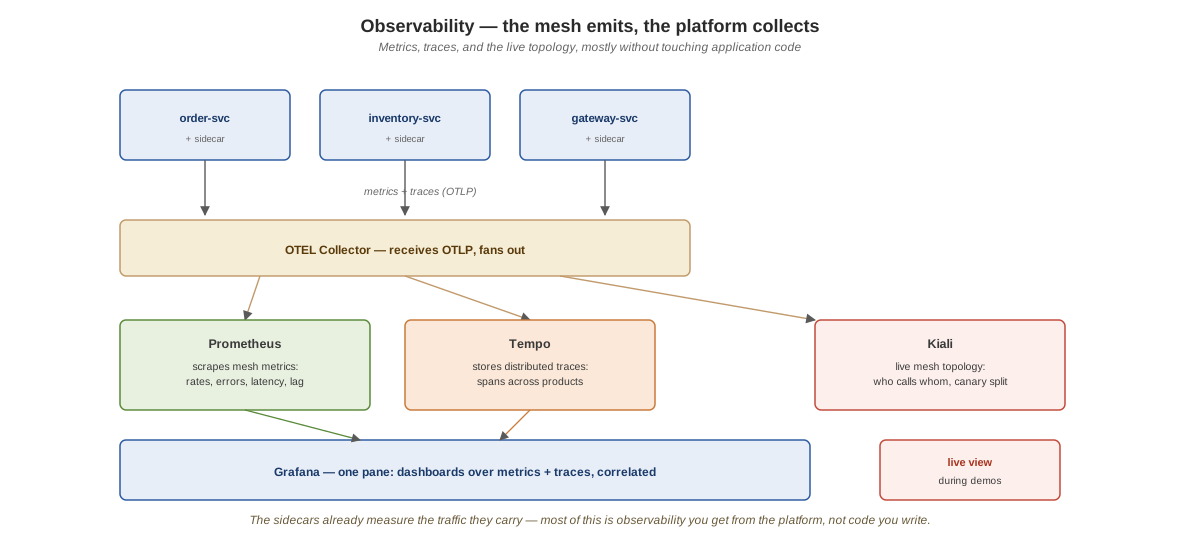
The first pleasant surprise is how much you get without instrumenting anything. Because the services are in the service mesh, the sidecars already emit request-level metrics — counts, latencies, error rates for the traffic flowing between products — and a Prometheus that scrapes them gets a detailed picture of inter-product traffic without a single line of metrics code in the services. This capstone leans on exactly that: the metrics half of observability adds nothing to the application code, because the mesh is already measuring the traffic it carries. Grafana then turns those metrics into the dashboards you’d actually watch — the gateway’s request volume rising, KEDA spinning up replicas in response, the canary’s traffic split landing where the weights say it should.
That “for free” property is the self-serve platform principle showing up again: a domain team gets request metrics for its product because the platform’s mesh provides them, not because the team instrumented anything.
Traces across products
Metrics tell you that something is slow or failing; traces tell you where. Distributed tracing assigns a request an identity that propagates as it crosses product boundaries, so the work each product does on its behalf becomes a connected tree of spans — one request, many products, one trace.
This capstone collects traces in Tempo and instruments the gateway as the trace source, and that choice is deliberate. The gateway is the entry point for the federated read path, so a single GraphQL query there produces the most instructive trace there is in this system: an HTTP server span for the query itself, a REST client span for the call out to order-service, and a gRPC client span for the call to inventory-service — all three protocols from the data planes page appearing as nested spans in one trace. You can see the composition happen: the gateway fanning out to two products over two different protocols and assembling the result. One well-chosen instrumentation point illuminates the whole read path.
Instrumenting the entry point first, and leaving deeper per-service instrumentation as a follow-on, is the same incremental discipline the rest of the build follows — one new capability at a time, each verifiable before the next.
The live mesh view
Metrics and traces are recorded and queried after the fact. The other thing you want with a mesh is a live picture of the topology — which products are talking to which, right now, with traffic rates and health on the edges between them. That’s what a mesh-visualization layer such as Kiali provides: a real-time graph of the products and the traffic between them, drawn from the same mesh telemetry the metrics come from. During a canary it shows the v1/v2 split as live traffic on the graph; when a product is struggling, the unhealthy edges are visible in the topology. For a system whose defining behavior is products talking to each other, a live map of exactly that is the single most legible view available.
What it all adds up to
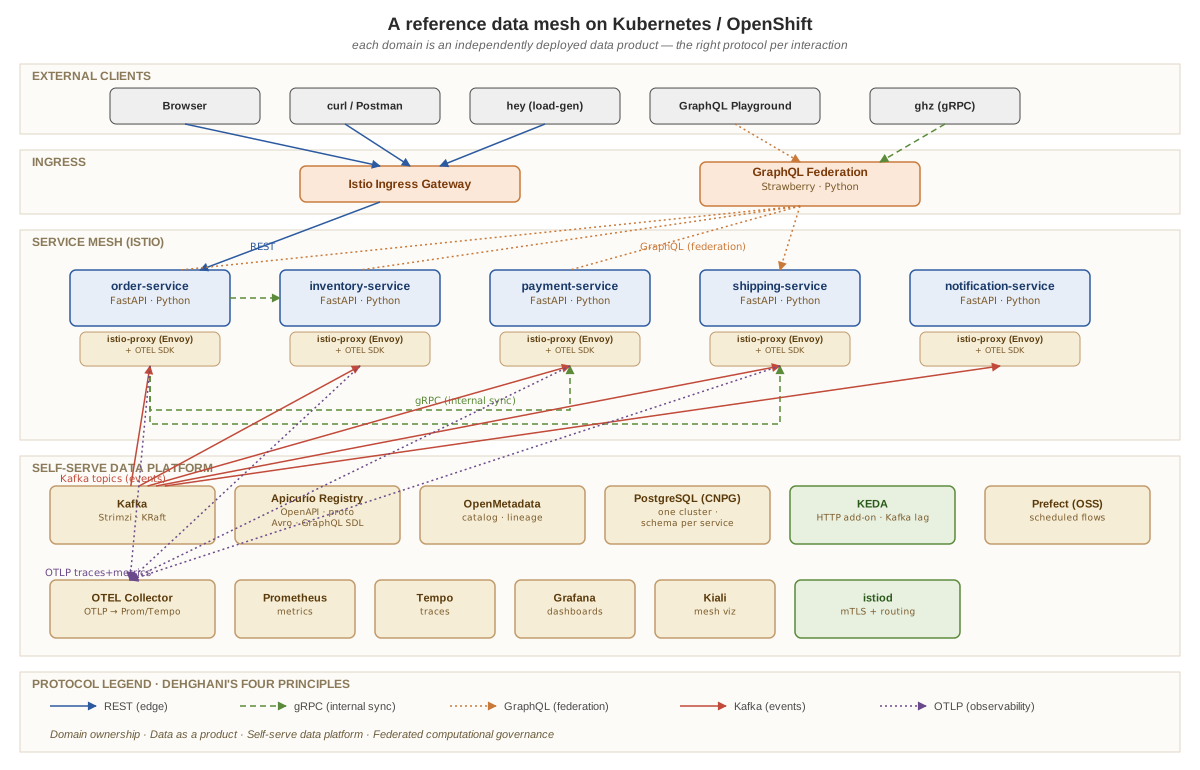
Put the pieces together and the mesh becomes legible end to end. A single GraphQL query appears as a trace whose spans cross three products and three protocols. The metrics show the gateway’s load and the autoscaler’s response to it. The catalog records the lineage of which products feed which. The mesh view shows the live topology, canary split and all. None of these is the system — they’re the instruments through which you understand a system too distributed for any single vantage point to capture. That’s the acceptance bar the capstone is built toward: not just that the mesh runs, but that you can watch it run — see a request thread across products, see a product scale to meet demand, see a contract roll out version by version, and see where every product’s data came from.
That completes the implementation. The build is a working data mesh: services that own their data as products, contracts and a catalog that make them discoverable, two data planes moving current state and propagating change, progressive delivery with mTLS, elastic scaling with recovery, and the observability to see all of it. The one thing left is to step back from how and look at what goes wrong — the conceptual and organizational failure modes that derail data-mesh efforts even when the technology is sound.