Elastic & resilient
Scaling to demand and to zero with KEDA, and the cloud-native recoverability the platform provides when things fail.
A data product’s demand isn’t constant. A read gateway is busy when consumers are querying and idle otherwise; an event consumer has work only when events are flowing. Provisioning every product for its peak, all the time, wastes resources; provisioning for the average means falling over at the peak. This page is about the platform handling that automatically — scaling products to match demand, including down to zero when there’s none — and about the other half of operating under real conditions: recovering when something fails. Both are self-serve platform capabilities: a domain team gets elasticity and resilience from the platform rather than building them.
Scaling to demand — and to zero
The standard Kubernetes autoscaler scales on CPU and memory, which is a poor proxy for the demand a data product actually faces. A read gateway’s load is requests; an event consumer’s load is messages waiting to be processed. KEDA — Kubernetes Event-Driven Autoscaling — scales on those real signals instead, and crucially it can scale a workload all the way to zero when the signal is absent, then back up when it returns.
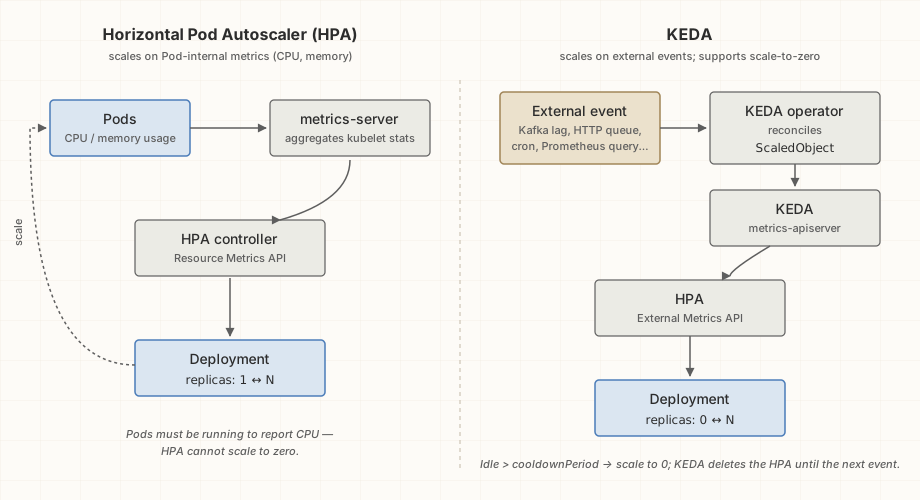
Scale-to-zero is what makes “elastic data product” more than a slogan. A product that costs nothing while idle can exist without justifying its standing footprint — you can have many such products, each materializing only when something actually asks for it. That’s a different economics from “every service holds a baseline of resources forever,” and it’s particularly apt for a mesh of many domain products with uneven, bursty demand.
This capstone wires up two scalers, deliberately of different kinds, on two different products:
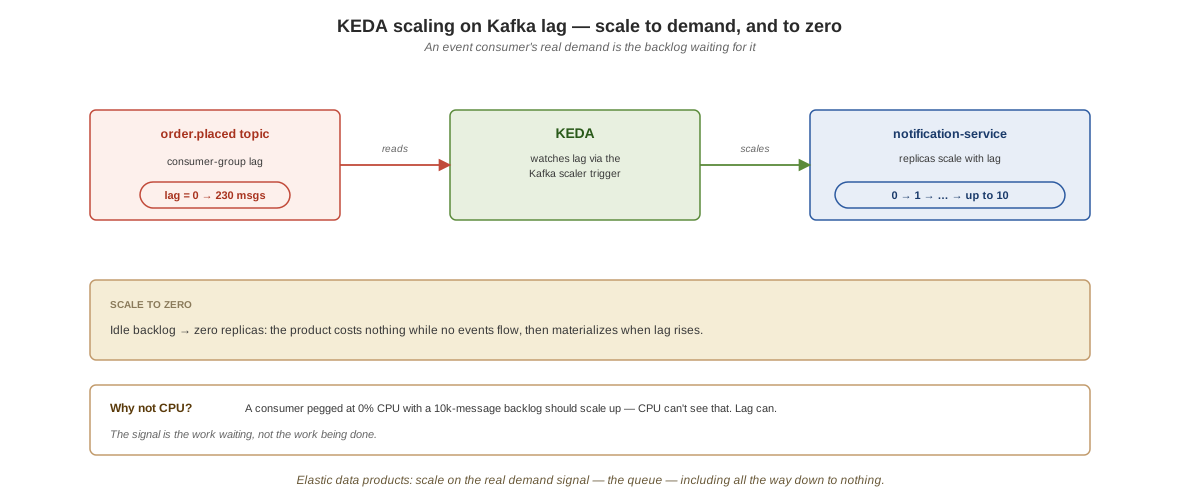
- Consumer-lag scaling on notification-service. notification-service is an event consumer — its real workload is the backlog of events waiting in its consumer group. A KEDA scaler watches that consumer-group lag and scales the service on it, down to zero when the backlog is empty and there’s nothing to do. When orders start flowing again, the lag rises and KEDA scales it back up.
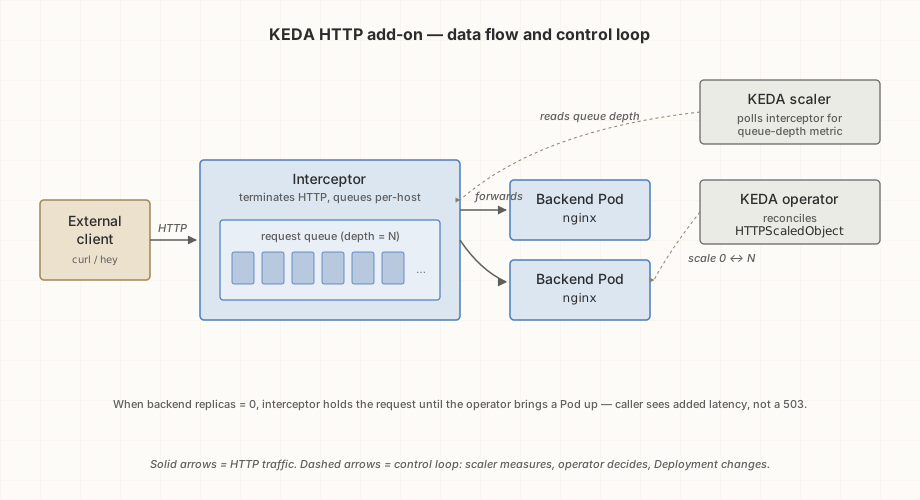
- HTTP-request scaling on the gateway. The read gateway’s load is incoming queries, so it scales on HTTP request volume via KEDA’s HTTP add-on — including to zero when no one is querying.
There’s a deliberate placement decision worth noting: the HTTP scaler goes on the gateway, not on order-service, because order-service is where the canary lives, and HTTP-scaling a service whose traffic is being split by weight would have the two mechanisms fighting over the same pods. The gateway is a natural synchronous-read load target with no such conflict. Matching each scaler to the right product — lag-based for the consumer, request-based for the gateway, and neither on the canaried service — is the kind of fitting-the-mechanism-to-the-workload judgment the whole capstone keeps returning to.
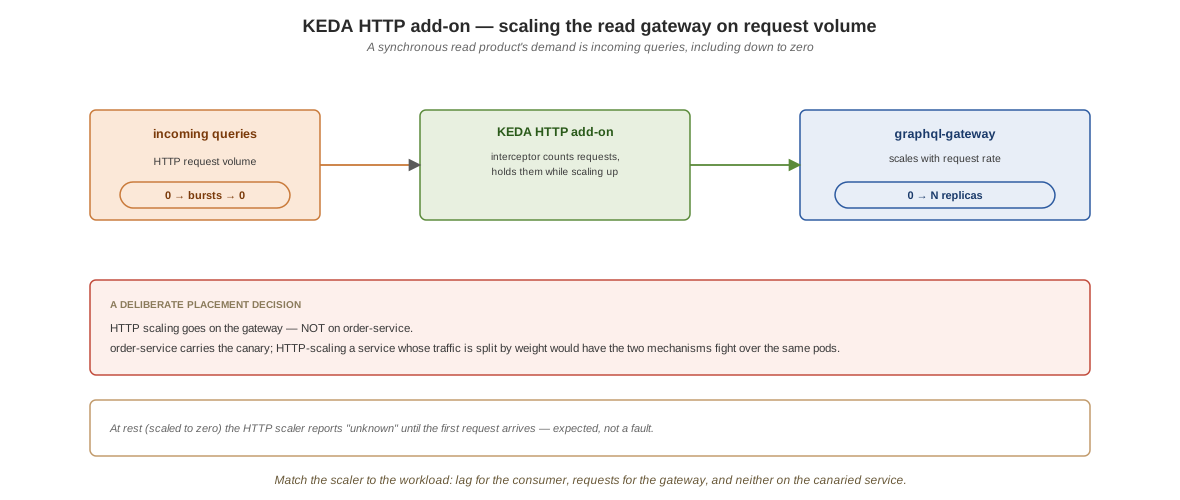
One harmless quirk you’ll see at rest: with the gateway scaled to zero, its HTTP scaler reports an “unknown” status until traffic first arrives and the add-on has something to measure. That’s expected — a scaled-to-zero workload has no current metric — and it resolves the moment a request hits the gateway.
Resilience: recoverability as a platform property
The other half of operating under real conditions is what happens when things break — and on a real system, things break. The cloud-native answer isn’t “prevent all failure”; it’s “make recovery cheap and automatic.” Kubernetes provides a great deal of this for free, and a data mesh inherits it: a crashed pod is restarted, a failed deployment is rolled back, a node’s workloads are rescheduled, and declarative state means the system continuously reconciles back toward what you asked for rather than drifting away from it. A data product deployed this way is recoverable by construction — you can kill it and the platform brings it back.
That property is worth designing toward, not just relying on. A product that recovers cleanly is one that doesn’t hold critical state only in memory, that can be restarted without manual intervention, that comes back to a known-good state after a crash rather than a corrupted one. Much of what the earlier pages established serves this: operator-managed infrastructure knows how to recover the systems it manages, the event backbone lets a consumer that was down catch up on the backlog it missed, and declarative deployment means re-applying the desired state is always a valid recovery move.
The capstone runs on a single node, which makes recoverability both more visible and more demanding than a multi-node cluster would — a single node concentrates the failure modes that several nodes would spread out and absorb. Operating a long-lived single-node cluster well turns out to require real care: knowing when to let the platform self-heal versus when to cycle a node, recognizing the difference between a workload failure and an infrastructure failure beneath it, and giving stateful workloads enough resources to recover rather than just to run. Those operational lessons are specific and hard-won, and they’re collected as gotchas rather than mixed in here — but the conceptual point stands: a mesh built on a platform that reconciles toward declared state is far more resilient than one held together by manual operations, and that resilience is something the domains get from the platform rather than each building their own.
Elastic and resilient, from the platform
Elasticity and recoverability are the same kind of thing from a domain team’s point of view: capabilities the self-serve platform provides so that individual products don’t each have to solve them. A product scales to its demand because the platform scales it; a product survives a crash because the platform reconciles it back. The domain declares what it wants and the platform delivers the operational behavior — which is exactly the self-serve principle, now applied to the runtime properties of a product rather than just its deployment.
Last, the capability that makes all of this observable: seeing what the mesh is actually doing — its metrics, its traces, and the live view of traffic moving between products.