Observability
OpenTelemetry tracing and Micrometer/Prometheus metrics riding across the REST-to-gRPC seam in call metadata, plus the library's own grpc.health.v1.Health check — no contract change, no manual propagation code
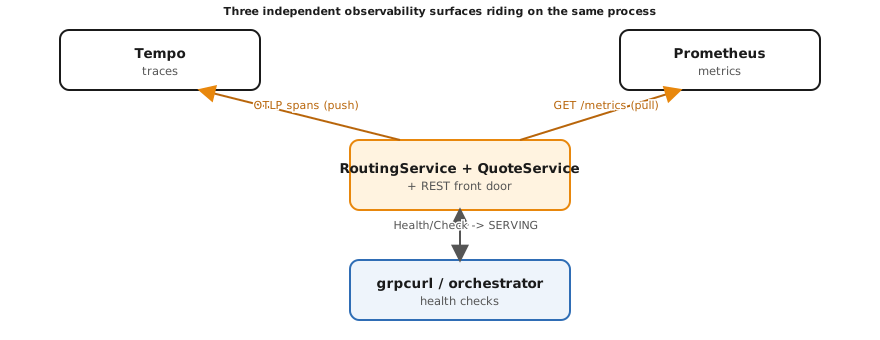
Chapter 20’s interceptor logged two things about every call: the method name and how it ended, UNAUTHENTICATED or PERMISSION_DENIED or whatever status the handler itself returned. That log line answers “what happened” for one call, read by one engineer, in one terminal. It does not answer “where did the time go across three services,” “is this error rate new in the last ten minutes,” or “is this particular instance still capable of taking traffic” — three different questions, asked by three different tools, each needing a different shape of signal. This chapter wires up all three: a trace that follows one request across a REST boundary and two gRPC hops, a metric that counts and times every call a server handles, and a health check a load balancer or orchestrator polls without understanding anything about shipping routes or quotes. None of it touches shipping.routing.v1.RoutingService or shipping.quote.v1.QuoteService’s proto definitions — tracing and metrics ride entirely in gRPC metadata and in the OpenTelemetry/Micrometer SDKs’ own machinery, and health is served by gRPC’s own standard grpc.health.v1.Health service, not a bespoke endpoint this chapter invents.
The code is in examples/21-observability/. The run script there (verify.sh) builds and starts both stacks — including, for the first time in this book, an always-on Grafana LGTM stack rather than an opt-in one — and asserts every claim this chapter makes against both of them; its README.md covers what it does and how to drive it by hand.
Three signals, three different jobs
“Observability” is often used as though it named one thing a service either has or lacks. It names three, and conflating them produces dashboards that answer the wrong question for whoever is looking at them under pressure:
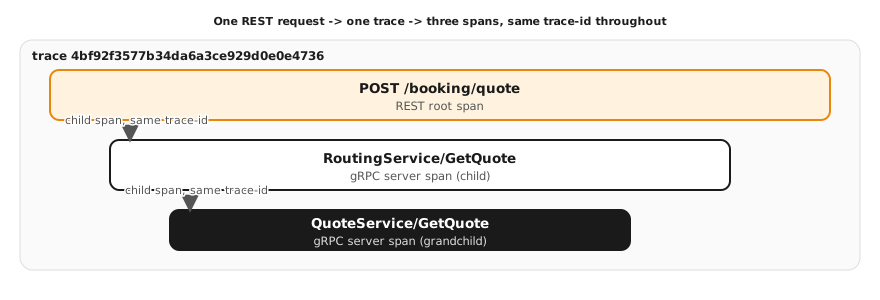
- Traces answer “where did this one request’s time go, and across how many hops.” A trace is a tree of spans, each one timing a unit of work, linked by a shared trace id and a parent/child relationship. This chapter’s example produces exactly one trace per
POST /booking/quotecall, with three spans in it. - Metrics answer “in aggregate, over this service, over this window, how many calls, how fast, how many failed.” A metric has no idea which specific request it came from — that is precisely what makes it cheap enough to keep forever and graph over months, where a trace only makes sense kept for hours or days.
- Health answers one narrow, synchronous question for one caller: “can this specific process instance take a request right now.” It carries no history and no aggregation — a load balancer asks it before every routing decision, not to understand the system, only to avoid sending traffic somewhere that cannot answer.
All three show up in this chapter’s example, and all three are standard, vendor-neutral shapes: OpenTelemetry for tracing, Prometheus’s text exposition format for metrics, and gRPC’s own grpc.health.v1.Health protocol for health — none of which this book invented, and none of which lock the reader into one vendor’s backend.
The REST-to-gRPC seam, traced automatically
POST /booking/quote is the one place in this example a client crosses the REST-to-gRPC seam this book keeps returning to: a REST handler accepting JSON, translating it into a GetQuoteRequest, and calling RoutingService.GetQuote over gRPC — which then calls DOWNSTREAM QuoteService.GetQuote over a second gRPC hop, the Chapter 10 two-service loopback shape, minus the deadline-carving logic that chapter needed and this one doesn’t.
On Quarkus, none of the propagation is code this chapter writes. quarkus-opentelemetry instruments quarkus-rest and quarkus-grpc automatically — quarkus.otel.instrument.rest and quarkus.otel.instrument.grpc both default to true — so the moment a request hits BookingResource.quote, a span already exists, and the moment that method calls its @GrpcClient("routing") stub, the client-side gRPC instrumentation injects a W3C traceparent into the outgoing call’s metadata before the bytes leave the process. RoutingServiceImpl.getQuote runs inside a server-side span the identical instrumentation already extracted that traceparent into — Span.current() there is a child of the REST span, not a disconnected root. The same thing happens one hop further in when RoutingServiceImpl calls its own @GrpcClient("quote") stub to reach QuoteServiceImpl. Three spans, one trace, and the only application code touching tracing at all is a single call to Span.current().getSpanContext().getTraceId() in each handler, used purely to log the id for this chapter’s own proof — not to propagate anything.
On Python, the same zero-code shape holds, achieved a different way: running the process under the opentelemetry-instrument wrapper (see python/Containerfile’s ENTRYPOINT) auto-discovers every installed instrumentation package at startup and patches the relevant entry points before any application code runs. opentelemetry-instrumentation-grpc wraps the grpc.aio server and the grpc.aio client channel the same way it already did in Chapter 10; opentelemetry-instrumentation-fastapi, new this chapter, patches fastapi.FastAPI.__init__ itself, so the FastAPI() instance app/api.py builds picks up tracing middleware with no instrumentor call anywhere in that file. RoutingServiceServicer.GetQuote and QuoteServiceServicer.GetQuote each read trace.get_current_span().get_span_context().trace_id purely to log it, exactly mirroring the Quarkus side.
Trace context is a metadata header, not a protocol extension
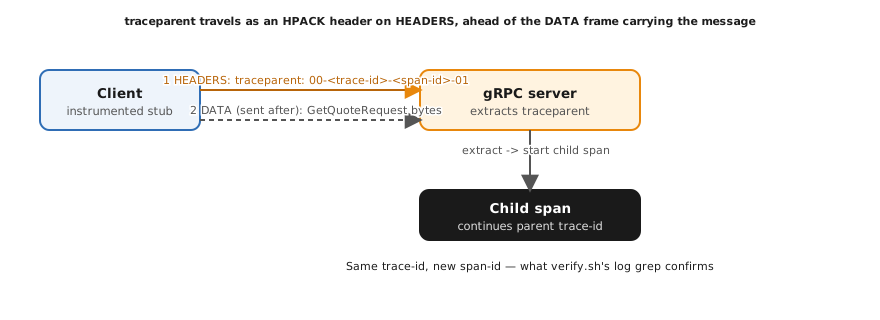
Nothing about gRPC was changed, extended, or specially configured to make this work, which is worth being explicit about because it is easy to assume tracing needs transport-level support it does not. A gRPC call’s Metadata/invocation_metadata is the same key-value header map Chapter 12’s AuthLoggingInterceptor and Chapter 20’s AuthzInterceptor already read to find an authorization entry; traceparent is just another entry in that same map, defined by the vendor-neutral W3C Trace Context specification as a single string: a version, a 32-hex-character trace id, a 16-hex-character parent span id, and a trace-flags byte, joined by hyphens. Figure 21.2 draws the consequence of where that header sits on the wire: gRPC’s HEADERS frame — which HTTP/2 always transmits before the DATA frame carrying the request message — is where traceparent travels, which means a server’s tracing instrumentation can start (or reject) a span before it has spent any work deserializing the request body. The same per-call, not per-connection, property Chapter 20 relied on for authorization applies here too: a client that keeps one HTTP/2 connection open across many calls (as Chapter 18 insists it should) attaches a fresh traceparent to every one of those calls, because every call belongs to its own trace.
Because this chapter keeps the Chapter 10 loopback topology — RoutingService and QuoteService running in the SAME process — both services’ spans share ONE OpenTelemetry resource, meaning one service.name value per stack. That is a real constraint of the topology, not an oversight: a single stack’s trace never carries two distinct resource-level service names, because there is only one OpenTelemetry SDK instance in that process. What distinguishes the two services inside Tempo instead is each span’s own rpc.service attribute — shipping.routing.v1.RoutingService versus shipping.quote.v1.QuoteService — set automatically by the gRPC semantic-convention instrumentation on both stacks, with no extra code anywhere in this example. A deployment where QuoteService is its own separately-deployed process would show two distinct service.name resources instead, with zero code change — the shared-process shape is this book’s teaching-budget compromise, not a limit of OpenTelemetry itself.
Metrics: one automatic, one hand-written, same shape
Quarkus and Python arrive at gRPC server metrics from opposite directions, and the gap between them is instructive. On Quarkus, adding quarkus-micrometer-registry-prometheus to the classpath is the entire implementation: the Quarkus gRPC guide states that “gRPC server metrics are automatically enabled when the application also uses the quarkus-micrometer extension” — no interceptor, no binder configuration, nothing in RoutingServiceImpl or QuoteServiceImpl acknowledges metrics exist. GET /q/metrics (Micrometer’s default Prometheus endpoint, shared with every other metric the JVM or Quarkus itself emits) answers with grpc_server_processing_duration_seconds_count{method="GetQuote",service="shipping.routing.v1.RoutingService",...} and its sibling series — summary counts, sums, and a max gauge — the moment a single call has been handled.
grpcio ships no equivalent. There is no Prometheus binder in the standard distribution the way Micrometer ships one for Quarkus, so app/metrics.py’s MetricsInterceptor writes the same shape by hand, using the prometheus-client library directly: a Counter named grpc_server_handled_total, labeled by service, method, and the gRPC status code the call closed with, and a Histogram named grpc_server_handling_seconds timing the same calls. The interceptor follows the identical resolve-then-wrap structure Chapter 12’s AuthLoggingInterceptor and Chapter 20’s AuthzInterceptor already established — continuation(handler_call_details) resolves the real handler without invoking it, and the interceptor wraps (never replaces) its unary_unary behavior function with a try/finally that records both series regardless of whether the call succeeded. Only unary handlers are wrapped, because GetQuote is the only shape either service actually implements in this chapter; a production interceptor covering streaming RPCs too would extend the same wrapping to all four handler shapes, the way Chapter 20’s _with_logging does. GET /metrics — a route this chapter adds to the same FastAPI app that serves /booking/quote — calls prometheus_client.generate_latest() to answer in the identical Prometheus text format Quarkus’s /q/metrics uses, so the two stacks are indistinguishable to whatever scrapes them.
Health: the library’s own protocol, not a custom endpoint
grpc.health.v1.Health is a tiny, standard gRPC service — a Check unary RPC taking an optional service name and returning a SERVING/NOT_SERVING/UNKNOWN enum, plus a Watch server-streaming variant for callers that want to be pushed status changes rather than polling. Every gRPC-aware load balancer, service mesh, and orchestrator (Kubernetes’s gRPC readiness/liveness probes among them) already knows how to call it, which is the entire argument for using it instead of inventing a /healthz REST endpoint that only speaks a protocol gRPC tooling has to be taught separately.
On Quarkus, this needed no code and no extra dependency: quarkus-grpc registers the Health service automatically for every @GrpcService bean present in the application — confirmed directly against the Quarkus 3.40 gRPC service-implementation guide rather than assumed, since a silent default like this is exactly the kind of fact worth checking against the source rather than guessing from memory. RoutingServiceImpl and QuoteServiceImpl being @GrpcService beans is the only thing that needed to be true.
On Python, grpcio-health-checking supplies the implementation, but which class to import matters more than it looks: grpc_health.v1.health.HealthServicer is the classic, synchronous implementation, meant for a threaded grpc.Server; registering it on this chapter’s grpc.aio server produces a TypeError the moment a MetricsInterceptor (or any grpc.aio-aware code) tries to await a response that was never a coroutine to begin with — a mistake this chapter’s own authoring process made and caught by actually running the stack, not by reading the library’s docs and assuming compatibility. The fix is grpc_health.v1.health.aio.HealthServicer, the asyncio-native implementation whose Check and set methods are both coroutines, matching every other piece of this process. app/main.py sets SERVING for the empty service name (the overall server) and for each implemented service’s fully-qualified proto name — shipping.routing.v1.RoutingService and shipping.quote.v1.QuoteService — which is what grpcurl -d '{"service":"..."}' ... Health/Check looks up when a caller names a specific service rather than asking about the server as a whole.
How the code works
The REST front door (both stacks). BookingResource.quote (Quarkus) and the booking_quote handler inside app/api.py’s create_app (Python) accept the same minimal JSON body — origin, destination, cargoKg — and build the identical GetQuoteRequest any other gRPC client in this book would, with one cargo item carrying only a weight. Both stacks render response field names in camelCase: Jackson’s default for the Quarkus BookingQuoteResponse record, and pydantic.alias_generators.to_camel applied to a shared CamelModel base on the Python side, with populate_by_name=True so the models also accept snake_case if something upstream ever sends it. The two response shapes are therefore byte-for-byte comparable, which is what lets verify.sh issue one request body and run one set of JSON-field assertions against both stacks’ responses.
Two loopback stubs, one loopback channel (Python). RoutingServiceServicer needs a QuoteServiceStub to call downstream, and the FastAPI handler needs a RoutingServiceStub to call RoutingService.GetQuote from the REST layer — two different stubs, but both dialing the same localhost:9000. app/main.py builds ONE grpc.aio.insecure_channel and constructs both stubs from it, rather than opening two separate loopback TCP connections to the same port: a grpc.aio.Channel supports any number of stubs for any number of services at the address it connects to, and there is no reason to pay for a second connection setup just because two different pieces of code happen to be the ones dialing it.
Running two servers in one event loop (Python). app/main.py’s serve() starts the grpc.aio server AND a uvicorn.Server running the FastAPI app, side by side, with await asyncio.gather(server.wait_for_termination(), http_server.serve()). Quarkus needs no equivalent code — its gRPC server and its Vert.x-based HTTP server are both managed by the Quarkus runtime itself, each on its own configured port (9000 and 8080 respectively, mapped to the host ports this chapter’s compose.yaml publishes), with no application code starting either one explicitly.
The always-on LGTM stack. Every prior chapter’s compose.yaml gated lgtm behind profiles: ["observability"], opt-in so CI and a first boot stayed fast. This chapter drops that guard — tracing, metrics, and health are the subject, not a side feature — and adds depends_on: condition: service_healthy so neither app stack starts serving traffic before Tempo, Prometheus, and the OTLP collector bundled into the image are actually ready to receive what they emit. One fix was needed to make that healthcheck real rather than decorative: the grafana/otel-lgtm:0.36.0 image’s RHEL 9 base carries curl but not wget, so the wget -qO- healthcheck command every prior chapter’s (opt-in, never actually exercised as a hard dependency) lgtm service copied verbatim fails outright the moment something depends on it succeeding. curl -fsS is the fix applied here, discovered by running the stack rather than by reading the image’s changelog.
Cross-check
A trace id logged by a handler and a trace id returned in a REST response proves propagation only if nothing upstream could have faked the match — the strongest independent check available without a second tracing implementation is to go straight to the storage backend and ask it the same question verify.sh’s log grep already answered a different way:
TRACE_ID="$(curl -s -X POST localhost:8210/booking/quote -H 'content-type: application/json' \
  -d '{"origin":"USNYC","destination":"NLRTM","cargoKg":1000}' | python3 -c 'import json,sys; print(json.load(sys.stdin)["traceId"])')"
sleep 5
curl -s "http://localhost:3200/api/traces/${TRACE_ID}" | python3 -m json.tool
Tempo’s own stored trace — ingested independently through the OTLP collector, with no knowledge of this chapter’s log statements — contains spans whose rpc.service attributes name both shipping.routing.v1.RoutingService and shipping.quote.v1.QuoteService under the identical trace id the REST response and the container logs both reported. Three independent observers — the REST response, the container’s stdout, and Tempo’s own storage — agreeing on one trace id is a materially stronger claim than any one of them alone.
What you learned
- Traces, metrics, and health are three different questions — “where did this one request’s time go,” “what does this service’s behavior look like in aggregate,” and “can this one instance take traffic right now” — and each has a standard, vendor-neutral shape: OpenTelemetry, Prometheus’s text format, and
grpc.health.v1.Health. - A W3C
traceparentis just another entry in the same gRPC metadata map Chapter 12 and Chapter 20 already read for other reasons — propagating a trace across a REST-to-gRPC boundary and a second downstream gRPC hop needed zero manual injection or extraction code on either stack, only instrumentation libraries wired in once at startup. - Automatic instrumentation differs by how much of the SDK’s auto-configuration machinery a framework owns: Quarkus’s build-time extension model lets
quarkus-opentelemetryandquarkus-micrometer-registry-prometheuswire themselves in with zero application code, whilegrpcio’s metrics gap had to be filled by a hand-rolled interceptor, built on the exact same resolve-then-wrap shape this book’s auth interceptors already established. - A health check answering
SERVINGforgrpc.health.v1.Healthis a different claim from “the business logic behind this process is correct” — it says only that this specific instance is prepared to accept gRPC calls right now, which is precisely the narrow, synchronous question a load balancer needs answered before every routing decision. - Verifying an asyncio-based library integration by actually running it catches mistakes a docs read does not:
grpc_health.v1.health.HealthServicer(classic/synchronous) versusgrpc_health.v1.health.aio.HealthServicer(asyncio-native) look interchangeable from an import statement and are not.
On the wire
Server reflection lists grpc.health.v1.Health alongside both shipping services:
grpcurl -plaintext localhost:9210 list
grpc.health.v1.Health
grpc.reflection.v1.ServerReflection
grpc.reflection.v1alpha.ServerReflection
shipping.quote.v1.QuoteService
shipping.routing.v1.RoutingService
The health check, naming the empty string for “the server as a whole”:
grpcurl -plaintext -d '{"service":""}' localhost:9210 grpc.health.v1.Health/Check
{
  "status": "SERVING"
}
The traced booking call — the same request verify.sh issues against both stacks:
curl -s -X POST localhost:8210/booking/quote -H 'content-type: application/json' \
  -d '{"origin":"USNYC","destination":"NLRTM","cargoKg":1000}'
{
  "traceId": "4bf92f3577b34da6a3ce929d0e0e4736",
  "quote": { "currency": "USD", "amount": "2500.00" },
  "route": { "id": "rte_USNYC-NLRTM", "legs": [ { "carrier": "MAERSK" } ] }
}
And the pointer that traceId hands a reader straight into Grafana — the always-on lgtm service’s Tempo datasource answers the moment the trace has ingested, no separate query language to learn for a first look:
curl -s http://localhost:3200/api/traces/4bf92f3577b34da6a3ce929d0e0e4736 | python3 -m json.tool
# or: open http://localhost:3000, Explore -> Tempo, paste the traceId
Swap port 8210/9210 for 8211/9211 and the Python stack answers all three calls identically — same quote formula, same trace-propagation mechanism, same health protocol — because examples/21-observability/verify.sh asserts precisely that for both stacks before it prints PASS.
Decision
Trace the boundaries a request actually crosses — a REST-to-gRPC seam, a downstream gRPC hop, anywhere ownership of a request changes hands — and let the framework's auto-instrumentation do the propagation; reach for manual span code only where auto-instrumentation cannot see the hop (a message queue, a background job scheduled from inside a span). Measure what a production on-call engineer will actually query under pressure: request count, error rate, and latency distribution per method, the same three Micrometer and a hand-rolled Prometheus interceptor both produce here, rather than a wall of bespoke gauges nobody has a dashboard for. Use grpc.health.v1.Health for liveness/readiness, never a REST endpoint reinventing the same protocol gRPC-aware infrastructure already speaks. And before this chapter's always-on, trace-every-request stack reaches production: dial sampling down from "always" — a head-based sampler keeping a fixed percentage of traces, or a tail-based one in the OpenTelemetry Collector keeping every error and a sample of the rest — because a service handling real traffic volume cannot afford to export, store, and query a full trace for every single request the way this chapter's teaching stack does.
Verification status: verified. examples/21-observability/verify.sh was run end to end against both stacks, twice, with the always-on lgtm service included in the bring-up: POST /booking/quote returned the correct quote (USD/2500.00/rte_USNYC-NLRTM/MAERSK) on both Quarkus (port 8210) and Python (port 8211); the SAME trace id appeared in a Routing-handler log line and a Quote-handler log line in each stack’s own docker compose logs output; Tempo’s /api/traces/<id> endpoint showed three distinct service.name/rpc.service values per trace on both runs (exceeding the two-service-minimum the check requires); each app’s own metrics endpoint (/q/metrics on Quarkus, /metrics on Python) showed a nonzero gRPC server metric count; and grpc.health.v1.Health/Check answered SERVING on both stacks. One real defect was found and fixed during this verification, not assumed away: the grafana/otel-lgtm:0.36.0 image has no wget binary, so its healthcheck was changed to curl; and the Python health servicer had to use grpc_health.v1.health.aio.HealthServicer, not the classic synchronous one, to work under grpc.aio.