Observability
Telemetry for an API with one endpoint: OpenTelemetry on both stacks, a trace joined to the caller's with a span per resolver and per source call, errors by code and deprecated-field usage as metrics, span metrics from Tempo, log records found by trace id, and what to leave out of all of it.
Chapter 1 warned that every GraphQL request hits one route, and Chapter 9 showed that a response with errors still answers 200. Both chapters pointed here. A server that answers every question the same way at the HTTP layer has to be observed at the GraphQL layer: by operation, by field and by error code. This chapter makes the tracking view do that on both stacks, and then reads the result back from the observability backend instead of trusting that it arrived.
The code is in examples/19-observability/. It starts from the Chapter 13 example and serves the same schema, so the SDL does not change and every source call is the one Chapter 13 counted. What changes is the telemetry around it. Both stacks export traces, metrics and logs over OTLP to one container, and verify.sh asserts what the backend holds. The three signals answer different questions: traces say where the time went, metrics say how often and which errors, and logs hold the detail of one failure.
One endpoint, every operation
An access log and a latency histogram keyed by URL and status describe POST /graphql and nothing finer. The fan-out page of Chapter 13 and a single cargo lookup share the route, the status and the histogram. A response that carries SERVICE_UNAVAILABLE at one edge is a 200 like all the others. A dashboard built from those two labels cannot tell a healthy service from one that fails a field in every response.
The unit that restores the distinction is the operation name. Chapter 15 asked every document to carry one for exactly this reason: query TrackCargo is a name a person can read in a trace and a team can own, and it comes from the client’s own document. A span or a metric keyed by operation name, and an error counted by extensions.code, sees the same traffic as separate things. Figure 19.1 splits the nine named requests verify.sh sends to one stack.
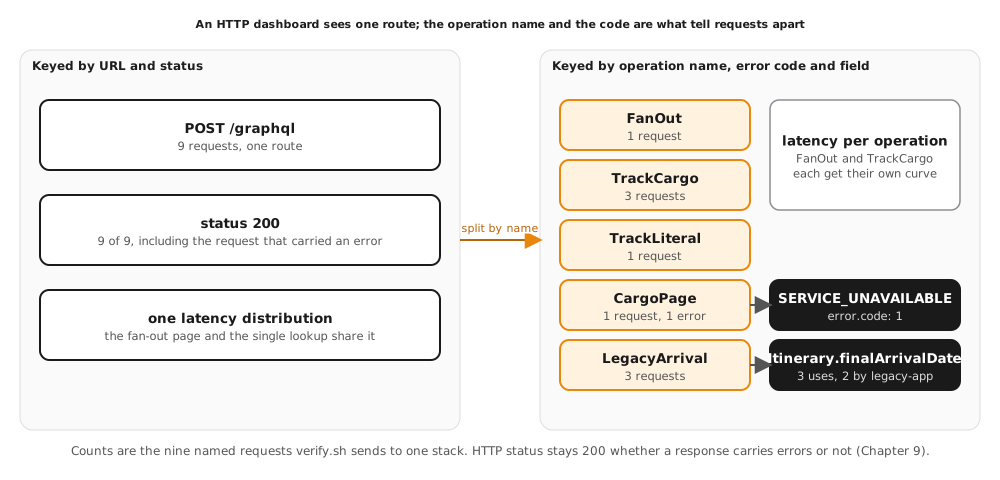
Operation names are not free. An anonymous operation gets the name anonymous in these metrics, and a client that omits names loses the split. Naming is a convention the server cannot enforce without rejecting documents, so it belongs in the client’s code generation or lint step, which Chapter 22 covers.
Three signals, one collector
OpenTelemetry is the vendor-neutral API, SDK and wire protocol for telemetry. An application records traces, metrics and logs through the API and exports them with OTLP, the OpenTelemetry protocol, to a collector. The collector receives OTLP and routes each signal to a store. The example runs grafana/otel-lgtm, an open source image that bundles a collector with Tempo for traces, Prometheus for metrics, Loki for logs and Grafana in front of them.
Each signal answers a different question about a GraphQL service. A trace answers where the time of one request went, per resolver and per source. A metric answers how often and how slow across many requests, and which errors by code, without keeping any one request. A log record answers what happened inside one failure, in the detail a response must not carry. The three are useful together only if one id joins them, and the trace id is that id.
Figure 19.2 shows the path. Both stacks export to the collector on port 4317 inside the compose network. The chapter’s block of host ports publishes the stores for verify.sh and for you: Grafana on 8292, Tempo on 8293, Prometheus on 8294 and Loki on 8295. They sit apart from the usual 3000, 9090 and 3200, so the example can run beside an observability stack of your own.
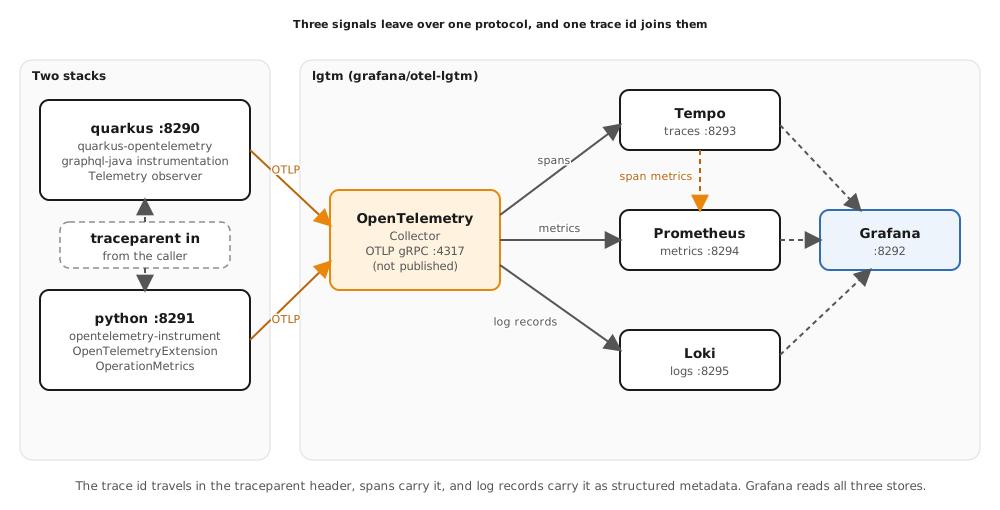
A trace belongs to the caller when the caller says so. The W3C Trace Context specification defines the traceparent header: a version, a 16-byte trace id, an 8-byte parent span id and flags. A server that honors it starts its HTTP span as a child of the caller’s span, in the caller’s trace. Both stacks do that without code, because the HTTP instrumentation reads the header. verify.sh relies on it: it chooses a trace id, sends traceparent with one request, and later asks Tempo for exactly that trace.
Sampling decides which traces are kept. The lab runs parentbased_always_on, the default: the server keeps every trace whose parent was sampled and starts a sampled trace when there is no parent. A busy service samples a fraction of its traces, and the percentage is a configuration choice that belongs to cost, not to the schema.
A trace per request, a span per resolver
One request produces one tree: the HTTP server span, an operation span below it, a span for each resolver that does work, and a span for each call into a source. The HTTP span comes from the web framework’s instrumentation. The other layers come from the GraphQL engine, and each stack gets them from its own ready-made component.
Quarkus adds quarkus-opentelemetry for the SDK, the exporter and the HTTP span, and the OpenTelemetry project’s opentelemetry-graphql-java-20.0, which instruments graphql-java and produces the operation span and a span per data fetcher. The Quarkus platform manages its version. Chapter 14 installed the cost budget through the GraphQL.Builder event that SmallRye fires before it builds the engine, and this chapter uses the same seam to append the instrumentation:
void instrument(@Observes GraphQL.Builder builder) {
    Instrumentation smallrye = builder.build().getInstrumentation();
    Instrumentation spans = GraphQLTelemetry.builder(openTelemetry)
            .setDataFetcherInstrumentationEnabled(true)
            .setQuerySanitizationEnabled(true)
            .setOperationNameInSpanNameEnabled(true)
            .build()
            .createInstrumentation();
    builder.instrumentation(new ChainedInstrumentation(List.of(smallrye, spans, tracking)));
}
schema = strawberry.Schema(
    query=Query,
    mutation=Mutation,
    config=StrawberryConfig(scalar_map=SCALAR_MAP),
    extensions=[
        partial(MaskErrors, should_mask_error=should_mask, error_message="Internal server error."),
        partial(OpenTelemetryExtension, arg_filter=drop_arguments),
        OperationMetrics,
    ],
)
SmallRye has an operation span of its own. The example turns it off with quarkus.smallrye-graphql.tracing.enabled=false, so each request has one operation span, from the OpenTelemetry instrumentation.
Python gets the HTTP span from opentelemetry-instrument, the zero-code wrapper in the Containerfile’s entrypoint, and the rest from Strawberry’s OpenTelemetryExtension. Strawberry builds one extension per request, so the schema lists a class or a factory, as the code above does with partial. The instrumentation skips introspection fields and fields that are plain attribute reads, so a trivial field costs nothing.
The two stacks name their spans differently, and the example asserts each stack’s own names:
| Layer | Quarkus | Python |
|---|---|---|
| HTTP | POST /graphql |
POST /graphql |
| Operation | query FanOut |
GraphQL Query: FanOut |
| Resolver | itinerary, with graphql.field.path |
GraphQL Resolving: itinerary, with graphql.path |
| Source | source.call |
source.call |
The source.call span is the same on both stacks. It wraps the one place every source read goes through, SourceCalls, and carries source.name and source.operation. On Quarkus the @WithSpan annotation from the OpenTelemetry instrumentation annotations creates it, and the span ends when the returned Uni completes:
@WithSpan("source.call")
public <T> Uni<T> call(
        String request,
        @SpanAttribute("source.name") String source,
        @SpanAttribute("source.operation") String op,
        String key,
        Supplier<T> lookup) {
On Python the tracer from the OpenTelemetry API opens it around the lookup:
with _TRACER.start_as_current_span(
    "source.call",
    attributes={"source.name": source, "source.operation": op},
):
Reading the trace
Figure 19.3 is the trace of the Chapter 13 fan-out, read back from Tempo by the id the script sent. The query pages four cargos with each cargo’s itinerary legs and delivery. It has four levels, and each level is one tick of the batching machinery from Chapter 13.
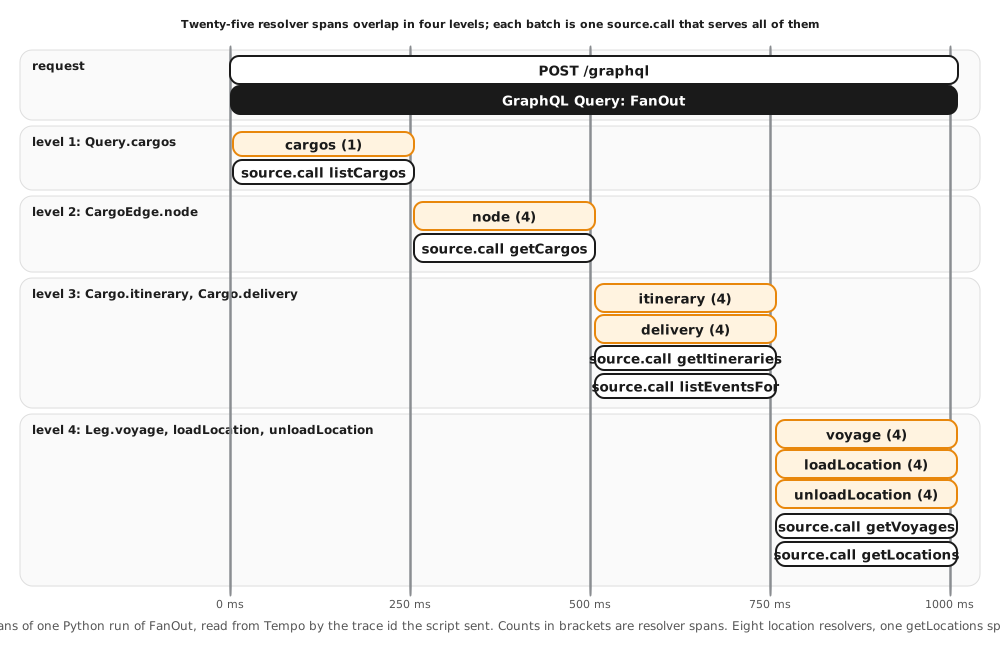
Reading a trace starts from its root. In Grafana, Explore with the Tempo data source takes a trace id and draws the same waterfall as Figure 19.3. The slowest resolver span is rarely the answer. The question is which level the time sits in and whether the batch below it served many resolvers or one. Here every level costs one source latency, so the query is as slow as its depth: four levels, about a second. Fewer calls would not make it faster. A shallower selection would.
Both stacks produce 25 resolver spans for this query: cargos once, then node, itinerary, delivery, voyage, loadLocation and unloadLocation four times each. trackingId, number, unLocode and transportStatus have none, and neither do edges and legs. The resolver spans of a level overlap, because the resolvers start together and wait for the same batch. They end when the value arrives, 250 ms later with the latency compose sets.
The batch is the visible part. Python has six source.call spans, one per bulk call, and exactly one is a getLocations span under eight location resolvers. Quarkus has eight, with two getLocations spans, because SmallRye batches per field and the two location fields have separate loaders, which is the 8-against-6 difference Chapter 13 measured. The trace now shows it without the call log. verify.sh asserts that the number of source.call spans equals the number of entries in the source-call log for the same request.
A batched source.call serves many resolvers, so it has no single resolver to hang under. On Python it is a child of the resolver span whose turn dispatched the batch. On Quarkus it is a child of whichever context was current when the engine dispatched it. In both traces it belongs to the request’s trace and descends from the HTTP span, which is what verify.sh asserts, and its time interval overlaps the resolvers it serves.
Errors in a trace
GHI345 is the cargo whose booking load fails, the seed of Chapter 9 and Chapter 13. The page cargos(last: 2) named CargoPage reaches it. The response is what Chapter 13 documented: SERVICE_UNAVAILABLE at the failing edge, the message booking service unavailable, and no class name or stack frame. The trace holds the rest.
On both stacks the span of the failing resolver ends in status ERROR and carries an exception event with the exception type, message and stack trace. On Quarkus both node spans of the failed batch end in ERROR, and so does the operation span, since SmallRye fails the whole batch. On Python only the span for GHI345’s edge does. The source.call span for the bulk read itself is not an error on either stack: the call returned, and one key in it failed. The detail that stays out of the response lives in the trace, which is where a person looks after a code arrives in a client’s report.
Metrics from spans
A span is a measurement of one call. Tempo’s metrics generator turns the spans it receives into Prometheus series without application code: traces_spanmetrics_calls_total and a latency histogram, labelled by service, span_name, span_kind and status_code. Because operation spans carry the operation name, the series are RED metrics per operation: rate, errors and duration. After three TrackCargo requests, verify.sh reads three calls for query TrackCargo on Quarkus and for GraphQL Query: TrackCargo on Python, with a latency count of three.
Generated metrics count spans by name and status. An error carried inside a 200 response is counted where it is recorded, by code, which is what the next two metrics do.
Metrics the spans cannot give
Chapter 9 promised that errors would be countable by extensions.code. Chapter 11 promised that the count of a deprecated field, by client, would say when the field can go. Both are counters recorded once per request at the operation level, through the engine’s own hook: a graphql-java Instrumentation on Quarkus, and a Strawberry SchemaExtension on Python.
graphql.errors counts each error of an executed operation (a document that fails to parse or validate never executes and is not counted), with the attributes error.code and graphql.operation.name. Both counters are recorded where the engine begins and ends an operation, not inside resolvers, so no resolver changes and no field can forget to count. The client name is read when the execution starts, on the thread that holds the HTTP request, and carried to the later callbacks in the instrumentation’s per-request state. The code is the one the client reads. An error without a declared code, such as a masked one, counts as unclassified, so the unexpected failures are visible as their own bucket. On Quarkus the instrumentation reads the code from the exception through the same provider that writes extensions.code, so the metric and the response agree.
graphql.field.deprecated.usage counts requests that select a deprecated field, once per field coordinate per request, with graphql.field.coordinate, graphql.operation.name and client.name. Both stacks find the fields by walking the selected operation against the schema, with graphql-java’s QueryTraverser and graphql-core’s TypeInfo, so aliases, fragments and variables resolve the way execution resolves them. The client name is the X-Client-Name request header, or unknown.
Prometheus translates the OTLP names: graphql.errors becomes graphql_errors_total, and error.code becomes the label error_code. verify.sh sends LegacyArrival, which selects Itinerary.finalArrivalDate, twice as legacy-app and once with no header. It reads two for legacy-app, one for unknown, and nothing from every other operation. When the count for a field stays at zero for a release cycle, the field can be removed, and the breaking gate of Chapter 11 will then agree.
The error counter shows Chapter 13’s blast radius as a number. One failed key produces one error on Python and two on Quarkus, so graphql_errors_total{error_code="SERVICE_UNAVAILABLE"} is 1 and 2 for the same request.
Logs that point at traces
A log record written while a span is current carries that span’s trace id and span id. Both stacks export logs over OTLP: Quarkus with quarkus.otel.logs.enabled=true and Python through the logging instrumentation that opentelemetry-instrument enables. Loki stores the trace id as structured metadata, so a query can select by it:
{service_name="ch19-observability-python"} | trace_id="<the id the script sent>" | exception_type=~".*SourceUnavailable.*"
The record for CargoPage holds the exception that the response masked down to a code and a message, with its stack. The client never sees that, and an operator who has the trace id from a trace or a support ticket can reach it in one query. The record does not carry the GraphQL path or a request id. The trace id is the join key.
What to record
Telemetry is data that leaves the process and lives longer than the request. Chapter 18 kept the token out of the context for that reason: the subject it authenticated is an identity a span may carry, and the token and the owner list stay out. The rule for telemetry follows the same line: record the shape of a request and keep its values out. Figure 19.4 sorts the attributes.
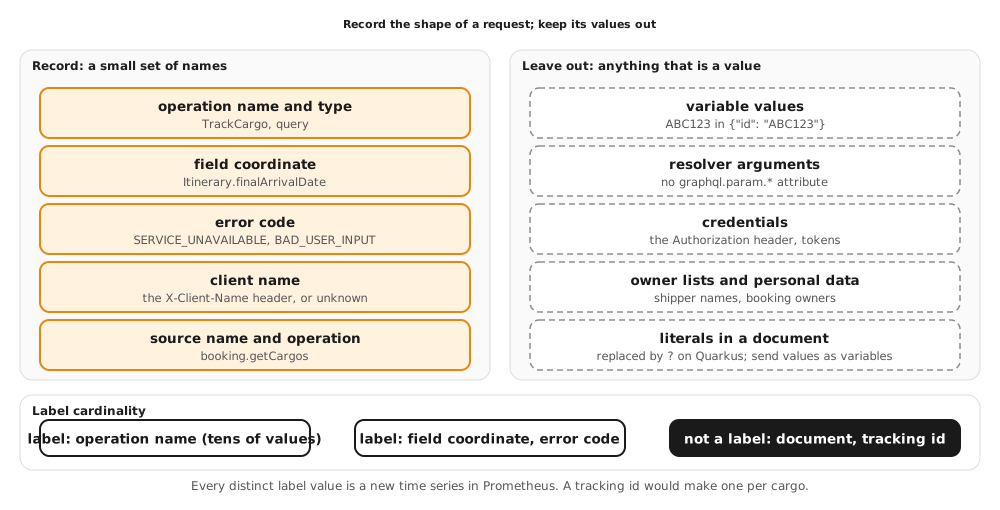
Span names follow the same rule as labels. The operation span is named for the operation, query TrackCargo, and not for the document, so the span metrics have one series per operation. That is the reason the Quarkus instrumentation is configured with the operation name in the span name: without it, every operation would share the name query and the generated metrics would be as blind as the URL dashboard of Figure 19.1.
Variable values never reach a span. The operation span’s document attribute shows query TrackCargo($id: TrackingId!) for a request sent with {"id": "ABC123"}, and verify.sh asserts that ABC123 appears in no attribute. A literal written into the document is part of the document. The OpenTelemetry instrumentation replaces literals with ? when it records the document, which query TrackLiteral{cargo(trackingId:?){trackingId}} shows, and the Python extension records the document as sent. The convention that serves both is the one clients already follow: send values as variables. Python’s arg_filter is drop_arguments, which returns an empty dict, so no span has a graphql.param.* attribute. The field coordinate says which resolver ran, and the argument would say for whom.
Metric labels have a stricter rule. Every distinct label value becomes its own time series in Prometheus. Operation name is a good label: a client has tens of operations, and they change by deployment. Field coordinate and error code are bounded by the schema. client.name comes from a header the client sets, so a service in production keeps it to the client names it has issued and maps the rest to unknown. A tracking id or a document is unbounded, so it can be a span attribute at most, and a client who sends generated documents can multiply the series count without limit. A credential is never an attribute: the HTTP instrumentation records no Authorization header here, and verify.sh asserts that no attribute key mentions a token.
On the wire
Start the stack. Quarkus is on 8290, Python on 8291, and the stores on 8292 to 8295.
docker compose -f examples/19-observability/compose.yaml up -d --build
TID=$(python3 -I -c 'import secrets; print(secrets.token_hex(16))')
curl -s localhost:8291/graphql -H 'Content-Type: application/json' \
  -H "traceparent: 00-$TID-00f067aa0ba902b7-01" \
  -d '{"query":"query TrackCargo($id: TrackingId!) { cargo(trackingId: $id) { trackingId delivery { transportStatus } } }","variables":{"id":"ABC123"}}'
{"data":{"cargo":{"trackingId":"ABC123","delivery":{"transportStatus":"ONBOARD_CARRIER"}}}}
Read the trace by the id you sent. Tempo answers a few seconds after the request:
curl -s localhost:8293/api/traces/$TID | python3 -I -c 'import json,sys; d=json.load(sys.stdin); print(sorted({s["name"] for b in d["batches"] for ss in b["scopeSpans"] for s in ss["spans"]}))'
['GraphQL Parsing', 'GraphQL Query: TrackCargo', 'GraphQL Resolving: cargo', 'GraphQL Resolving: delivery', 'GraphQL Validation', 'POST /graphql', 'POST /graphql http receive', 'POST /graphql http send', 'source.call']
Count the errors by code and the deprecated field by client from Prometheus:
curl -sG localhost:8294/api/v1/query --data-urlencode 'query=sum by (error_code) (graphql_errors_total)'
curl -sG localhost:8294/api/v1/query --data-urlencode 'query=sum by (client_name) (graphql_field_deprecated_usage_total{graphql_field_coordinate="Itinerary.finalArrivalDate"})'
Send the failing page under a trace id of its own, then find the failure’s log record by that id in Loki:
FID=$(python3 -I -c 'import secrets; print(secrets.token_hex(16))')
curl -s localhost:8291/graphql -H 'Content-Type: application/json' \
  -H "traceparent: 00-$FID-00f067aa0ba902b7-01" \
  -d '{"query":"query CargoPage { cargos(last: 2) { edges { node { trackingId } } } }"}'
curl -sG localhost:8295/loki/api/v1/query_range \
  --data-urlencode "query={service_name=\"ch19-observability-python\"} | trace_id=\"$FID\""
Stop the stack when done:
docker compose -f examples/19-observability/compose.yaml down -v
bash examples/19-observability/verify.sh runs the whole sequence on both stacks and prints PASS only when both hold. The values it asserts are in this table.
| Check | Quarkus | Python |
|---|---|---|
FanOut data and source calls |
Chapter 13’s data, 8 calls | Chapter 13’s data, 6 calls |
| HTTP span | one POST /graphql, child of the caller’s span |
the same |
| operation span | one query FanOut, descends from the HTTP span |
one GraphQL Query: FanOut |
| resolver spans | cargos 1; node, itinerary, delivery, voyage, loadLocation, unloadLocation 4 each; all descend from the operation span |
the same, named GraphQL Resolving: <field> |
| trivial fields | no span for trackingId, edges, legs, number, unLocode, transportStatus |
the same |
source.call spans |
8, equal to the call log; 2 for getLocations |
6; 1 for getLocations |
TrackCargo |
ONBOARD_CARRIER; the document attribute lacks ABC123; no graphql.param.* |
the same |
TrackLiteral |
the document attribute is query TrackLiteral{cargo(trackingId:?){trackingId}} |
the document is recorded as sent |
CargoPage |
SERVICE_UNAVAILABLE at the edge; both node spans and the operation span in ERROR; no class name or frame in the response |
the edge’s node span in ERROR, the other UNSET |
| span metrics | 3 calls and a latency count of 3 for query TrackCargo |
the same for GraphQL Query: TrackCargo |
graphql_errors_total |
SERVICE_UNAVAILABLE on CargoPage: 2 |
1 |
graphql_field_deprecated_usage_total |
Itinerary.finalArrivalDate: legacy-app 2, unknown 1, total 3 |
the same |
| log record | found by the trace id, exception type and message | the same |
| schema | conforms; finalArrivalDate deprecated; only Subscription unserved |
the same |
Decision
Observability is where the operational and security cost axis of Chapter 2 is paid or deferred, and the client diversity and shape variance axis decides what has to be visible: when every client writes its own selection, the only stable units are the operation name, the field coordinate and the error code. The aggregation across sources axis is why a span per resolver and per source call is worth its cost, since one document fans out to several owners and a total latency alone cannot say which one was slow. The contract and evolution style axis gains a measurement, the deprecated-field count by client. The tracking view therefore exports OpenTelemetry over OTLP, joins the caller's trace, records the operation, the field and the code and never a value, counts errors by code and deprecated usage by client, and finds a failure's log record by trace id.
Where this goes next
This chapter made one endpoint legible: a trace per request with a span per resolver and per source call, joined to the caller’s trace id, span metrics that need no application code and two counters at the engine’s operation hook, log records addressed by trace id, and a short list of what stays out.
The other examples in the series keep telemetry off by default and add the collector with a second compose file, compose.observability.yaml. A service that runs without a collector switches the SDK off: set OTEL_SDK_DISABLED=true for the Python SDK and QUARKUS_OTEL_SDK_DISABLED=true (quarkus.otel.sdk.disabled) for Quarkus, and add the collector’s compose file only when you want the signals. The compose file in this chapter shows the other side of that pattern, where the collector is a default service and the apps wait for it to be healthy.
Chapter 20 puts a gateway in front of two subgraphs. With Hive Gateway’s OpenTelemetry integration enabled, a distributed trace crosses the gateway: the gateway propagates traceparent to each subgraph, so one trace holds the gateway’s plan and every subgraph’s operation span, which is this chapter’s mechanism applied across services. For the specifications, read the OpenTelemetry specification’s “Trace Context” overview and its semantic conventions for GraphQL spans (graphql.operation.name, graphql.operation.type, graphql.document), and the W3C Trace Context recommendation. The Quarkus guides “Using OpenTelemetry”, “Using OpenTelemetry Tracing” and “Using OpenTelemetry Metrics” cover the Java side along with the OpenTelemetry Java instrumentation’s graphql-java library page, and Strawberry’s OpenTelemetry extension page and the OpenTelemetry Python zero-code instrumentation page cover Python. The Grafana Tempo documentation has the span metrics generator under “Metrics-generator”.