KEDA
Event-driven autoscaling on Kubernetes. Two patterns — Kafka consumer-lag scaling with Strimzi, and HTTP request scaling with the KEDA HTTP add-on — both with scale-to-zero.
§11 was about traffic between services. §12 is about how many copies of a service should be running. And specifically: when that answer should be zero during quiet periods, with the workload appearing only when there’s something to do.
That’s the difference between Kubernetes’ built-in Horizontal Pod Autoscaler (HPA) and KEDA — the Kubernetes Event- driven Autoscaler. HPA scales on resource metrics (CPU, memory) — it watches the Pods themselves and adds replicas when they’re hot. KEDA scales on events — Kafka consumer lag, RabbitMQ queue depth, HTTP request rate, Prometheus query results, AWS SQS message age, cron schedules, or any of 70+ built-in scalers. And critically, KEDA can scale a workload all the way to zero replicas during quiet periods, then back up the moment events start flowing.
This is the optional section in the PRD — the §3-§11 core works without it. But for anyone building consumer-style workloads (Kafka pipelines, queue processors, scheduled batch jobs) or HTTP services with bursty/intermittent traffic patterns, KEDA is the right primitive. By the end you’ll have:
- KEDA core installed via helm on the existing
minikubeprofile - Pattern A: Strimzi-managed Kafka cluster + Python consumer that scales from 0 to N based on consumer lag, then back to 0
- Pattern B: nginx-custom Deployment scaling from 0 to N based on HTTP traffic (via the KEDA HTTP add-on), then back to 0 after the load stops
HPA vs KEDA
The default HPA reads resource metrics from kubelet via metrics-server, then asks the Deployment to scale up or down based on CPU/memory pressure. The Pod has to be running to contribute its CPU number — so HPA can never legitimately scale to zero, because there’d be nothing to measure.
KEDA inverts the model: instead of measuring the Pods, it measures external events (Kafka consumer lag, HTTP request rate, queue depth, etc.) and asks for replicas based on those. Because the metric source is outside the Pods, the workload can sit at zero during quiet periods.
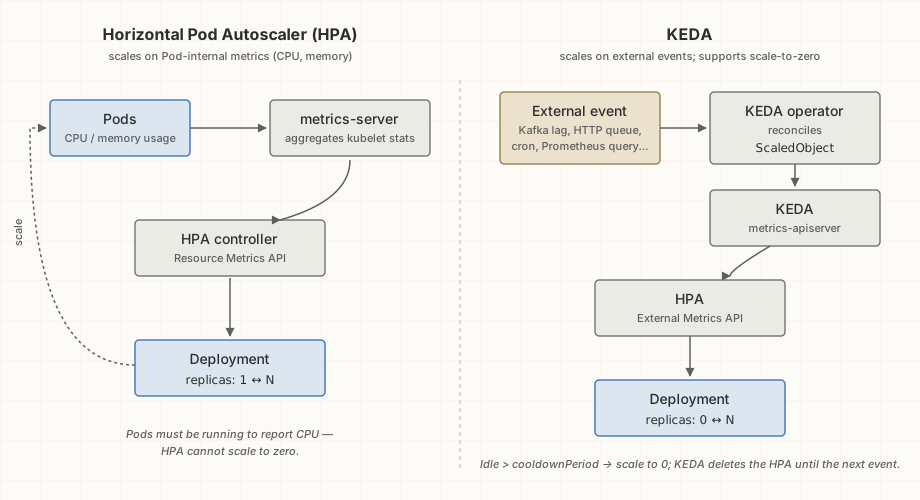
The clever part: KEDA doesn’t replace HPA — it provides the
External Metrics API that HPA was already designed to consume.
When a ScaledObject is created, KEDA generates an HPA behind
the scenes that’s wired up to KEDA’s own metrics adapter. From
HPA’s perspective, “Kafka consumer lag” is just another external
metric like any other.
The “scale to zero” comes from KEDA itself — when no events are
arriving and the deployment has been idle for cooldownPeriod
seconds, KEDA scales the Deployment to zero replicas and deletes
the underlying HPA (HPA can’t manage 0-replica Deployments). The
moment the next event arrives (next polling cycle, default 30s),
KEDA scales back up to minReplicaCount and recreates the HPA.
ScaledObject — the central CRD
The KEDA primitive is the ScaledObject. A single example:
apiVersion: keda.sh/v1alpha1
kind: ScaledObject
metadata:
  name: order-processor-scaler
spec:
  scaleTargetRef:
    name: order-processor       # what Deployment to scale
  pollingInterval: 5             # how often KEDA checks the trigger
  cooldownPeriod: 30             # how long idle before scale to 0
  minReplicaCount: 0             # the magic number
  maxReplicaCount: 10
  triggers:
    - type: kafka                # any scaler type
      metadata:
        bootstrapServers: my-kafka-kafka-bootstrap.kafka:9092
        consumerGroup: order-processor-group
        topic: orders
        lagThreshold: "5"        # one replica per 5 unprocessed messages
The Deployment named in scaleTargetRef should start with
replicas: 0 — KEDA will own the replica count from that point.
Apply both, and KEDA’s controller starts polling Kafka every 5
seconds. When consumer lag exceeds lagThreshold × current
replicas, replicas climb. When lag drops to zero and stays there
for cooldownPeriod, replicas drop to zero.
Prerequisites — back on the minikube profile
Unlike §11, this section uses the same minikube profile as §3-§10. No second cluster. Confirm:
kubectl --context minikube get nodes
# minikube  Ready  control-plane  ...
Every command below names --context minikube explicitly.
Resource sizing: KEDA core is small (~150 MB total — operator +
metrics adapter + admission webhook). The HTTP add-on adds
another ~200 MB (interceptor + scaler + operator). Strimzi’s
Cluster Operator is ~300 MB; the Kafka cluster you deploy is
sized at ~1 GB request / 1.5 GB limit. The Python consumer
workload at peak scale (10 replicas × ~50 MB) is another ~500 MB.
Total worst-case footprint for §12: roughly 2-3 GB on top of
whatever minikube profile is already running.
If you sized the profile per §3 (4 GB or larger), no action needed. If your profile is smaller and you want to scale it up, the safest approach is to delete and recreate:
minikube delete -p minikube
minikube start -p minikube --driver=docker --container-runtime=containerd \
    --kubernetes-version=v1.36.5 --memory=8192 --cpus=6 \
    --ports=127.0.0.1:18080:30080,127.0.0.1:18081:30808,127.0.0.1:18090:30900
The --ports map is CORE_PORTS from scripts/lib/_helpers.sh. It
has to be on the command line because published ports are fixed at
profile creation. Recreating the profile removes the §6-§9 images and
workloads; rebuild them by re-running those demos.
Installing KEDA
The scripts/setup-keda.sh script handles KEDA core plus the
HTTP add-on in one run:
./scripts/setup-keda.sh
What it does:
- Adds the
kedacorehelm repository - Installs KEDA 2.21.0 into the
kedanamespace - Installs the KEDA HTTP add-on 0.16.0 into the same namespace
- Waits for both deployments to be Available
After it returns:
kubectl --context minikube get pods -n keda
NAME                                                  READY   STATUS    AGE
keda-add-ons-http-controller-manager-...              1/1     Running   ...
keda-add-ons-http-external-scaler-...                 1/1     Running   ...
keda-add-ons-http-interceptor-...                     1/1     Running   ...
keda-admission-webhooks-...                           1/1     Running   ...
keda-operator-...                                     1/1     Running   ...
keda-operator-metrics-apiserver-...                   1/1     Running   ...
Seven Pods total. The four keda-add-ons-http-* Pods are
specifically for HTTP scaling and aren’t used by the Kafka
pattern (so you can helm uninstall keda-add-ons-http -n keda --kube-context minikube
without affecting Kafka scaling if you want a leaner install).
Beta notice. The KEDA HTTP add-on is officially in beta at v0.16.0. KEDA’s upstream README says plainly that the add-on is not yet recommended for production use while it is still under development and testing. For the tutorial it works fine; for production you’d evaluate alternatives (knative, Kedify HTTP Scaler, or wait for the add-on’s GA). KEDA core itself is GA and production-ready; the beta status applies only to the HTTP add-on.
API note. In 0.16 the
HTTPScaledObjectAPI (http.keda.sh/v1alpha1) is deprecated in favour ofInterceptorRoute. It still works, and this chapter keeps it for its simpler shape.
Pattern A: Kafka consumer-lag scaling with Strimzi
The first demo wires up the canonical KEDA pattern: a Kafka topic, a consumer that’s slow on purpose, and a ScaledObject that fires up more consumers when lag builds up.
Why Strimzi
Strimzi is a CNCF incubating project that runs Kafka on
Kubernetes via the operator pattern. You install the Cluster
Operator once via helm; from then on, Kafka clusters are
Kafka custom resources you kubectl apply, topics are
KafkaTopic resources, users are KafkaUser resources. The
operator handles the entire Kafka lifecycle — broker config,
KRaft setup, certificate rotation, rolling upgrades, the works.
Two practical notes upfront:
- Strimzi has historically had reconciliation quirks where the
Cluster Operator gets stuck in a NotReady state for opaque
reasons. The
setup-strimzi.shscript and the §12 Kafka demo include defensive timeouts and diagnostic dumps for this case - Bitnami’s Kafka helm chart is a simpler alternative if
Strimzi misbehaves on your machine. The KEDA
ScaledObjectmanifests inexamples/12-keda-kafka/work against any Kafka cluster reachable at a knownbootstrapServersaddress; you could replace Strimzi with Bitnami without changing anything KEDA-related
This tutorial uses Strimzi because the operator pattern itself is instructive — it’s the same shape as KEDA, cert-manager, the Istio operator, and dozens of other CNCF projects.
Install Strimzi
./scripts/setup-strimzi.sh
This installs the Strimzi Cluster Operator 1.2.0 into the
kafka namespace via helm. About 30 seconds. After it returns:
kubectl --context minikube get pods -n kafka
# NAME                                       READY   STATUS    AGE
# strimzi-cluster-operator-...               1/1     Running   30s
One Pod — the Cluster Operator. It watches for Kafka,
KafkaTopic, KafkaUser custom resources cluster-wide and
reconciles them into real Kubernetes resources (StatefulSets,
Services, Secrets, etc.) under the hood.
Define the Kafka cluster
The examples/12-keda-kafka/manifests/kafka-cluster.yaml is
minimal — a single-node KRaft cluster combining controller and
broker roles in one Pod (suitable for development, NOT
production):
apiVersion: kafka.strimzi.io/v1
kind: KafkaNodePool
metadata:
  name: dual-role
  namespace: kafka
  labels:
    strimzi.io/cluster: my-kafka
spec:
  replicas: 1
  roles:
    - controller
    - broker
  storage:
    type: jbod
    volumes:
      - id: 0
        type: persistent-claim
        size: 5Gi
        deleteClaim: false
        kraftMetadata: shared
---
apiVersion: kafka.strimzi.io/v1
kind: Kafka
metadata:
  name: my-kafka
  namespace: kafka
  annotations:
    strimzi.io/node-pools: enabled
    strimzi.io/kraft: enabled
spec:
  kafka:
    version: 4.3.1           # pinned; Strimzi 1.2.0 supports 4.2.x and 4.3.x
    # metadataVersion omitted: Strimzi defaults to match version
    listeners:
      - name: plain
        port: 9092
        type: internal
        tls: false
    config:
      offsets.topic.replication.factor: 1
      transaction.state.log.replication.factor: 1
      transaction.state.log.min.isr: 1
      default.replication.factor: 1
      min.insync.replicas: 1
  entityOperator:
    topicOperator: {}
    userOperator: {}
Notable choices:
- KRaft mode — no ZooKeeper. Strimzi 1.x is KRaft-only and
uses
KafkaNodePoolresources for every cluster. The manifest keeps thestrimzi.io/kraftandstrimzi.io/node-poolsannotations as documentation of that mode; they are harmless on 1.x - Dual-role node — combines controller + broker in one Pod. Smaller resource footprint than separate controller/broker pools. Production deployments split them
- Kafka 4.3.1 — pinned. Strimzi 1.x dropped support for
Kafka 3.x and ZooKeeper entirely, and accepts only the
kafka.strimzi.io/v1API (v1beta2manifests are rejected). ThemetadataVersionfield is omitted from the manifest — Strimzi defaults it to match the Kafka version on first cluster creation. Kafka 4.x removed ZooKeeper completely (KRaft-only), so there’s no zk-vs-kraft choice to make - Replication factor 1 everywhere — single-broker cluster can’t replicate, so insisting on RF≥2 would break topic creation
- Internal listener only — Pods inside the cluster reach
Kafka via
my-kafka-kafka-bootstrap.kafka:9092. No external exposure needed (KEDA scaler runs in-cluster) - EntityOperator — runs the Topic Operator and User Operator
as sidecars, which reconcile
KafkaTopicandKafkaUserCRs into actual Kafka topics and ACLs
Apply via examples/12-keda-kafka/demo.sh; the cluster takes
60-90 seconds to come up the first time (image pull + KRaft
formatting + readiness checks).
What a healthy cluster looks like
Once the Strimzi operator has reconciled the Kafka CR,
kubectl --context minikube get kafka,kafkanodepool,pod -n kafka shows the
fully-converged state:
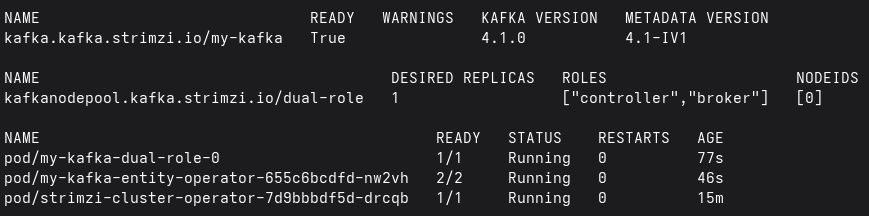
Reading top to bottom:
kafka/my-kafka True <version> <metadata version>— the Kafka CR is Ready, running Kafka 4.3.1 here (the screenshot was captured on an earlier release, so its version columns differ), with Strimzi having defaulted the metadata version to the matching 4.3 value (the manifest doesn’t specify it explicitly, which is why dropping that field was safe)kafkanodepool/dual-role 1 ["controller","broker"] [0]— one node pool with one replica playing both controller and broker roles, with assigned node ID0pod/my-kafka-dual-role-0 1/1 Running— the actual Kafka broker Pod (single-broker development cluster)pod/my-kafka-entity-operator-... 2/2 Running— the Topic Operator and User Operator running together as a 2-container Pod, reconcilingKafkaTopicandKafkaUserCRs into real Kafka topics and ACLspod/strimzi-cluster-operator-... 1/1 Running— the Cluster Operator itself, watching forKafka-shaped CRs and reconciling them. AGE here is much higher because the operator was installed earlier viasetup-strimzi.sh
If you see this output, everything is wired correctly and the
Kafka demo will work. If the kafka/my-kafka row shows
READY=False, the WARNINGS and conditions block in
kubectl --context minikube describe kafka/my-kafka -n kafka will tell you what’s
wrong — most commonly an unsupported version (the error caught
us during r13’s first run before this section was pinned to
a supported version).
Define the topic
apiVersion: kafka.strimzi.io/v1
kind: KafkaTopic
metadata:
  name: orders
  namespace: kafka
  labels:
    strimzi.io/cluster: my-kafka
spec:
  partitions: 3
  replicas: 1
  config:
    retention.ms: 7200000
Three partitions so KEDA has room to scale the consumer up to 3
replicas (one consumer per partition — Kafka’s parallelism unit).
The Topic Operator (running in the EntityOperator Pod) sees the
KafkaTopic CR and creates the actual topic.
The consumer
A small Python app that polls Kafka and “processes” each message
by sleeping 500 ms. Real consumers do real work; the sleep is
our stand-in for compute that takes time. Source at
examples/12-keda-kafka/consumer/consumer.py, packaged into a
UBI-based multi-stage image at
examples/12-keda-kafka/consumer/Containerfile:
import os, signal, sys, time
from kafka import KafkaConsumer

BROKER = os.environ.get("KAFKA_BROKER", "my-kafka-kafka-bootstrap.kafka:9092")
TOPIC = os.environ.get("KAFKA_TOPIC", "orders")
GROUP = os.environ.get("KAFKA_GROUP", "order-processor-group")
WORK_SLEEP_S = float(os.environ.get("WORK_SLEEP_S", "0.5"))

# Handle SIGTERM cleanly when KEDA scales us down
def graceful_exit(signum, frame):
    print(f"received signal {signum}; shutting down", flush=True)
    sys.exit(0)
signal.signal(signal.SIGTERM, graceful_exit)

consumer = KafkaConsumer(
    TOPIC, bootstrap_servers=[BROKER], group_id=GROUP,
    auto_offset_reset="earliest", enable_auto_commit=True,
)
for msg in consumer:
    print(f"offset={msg.offset} partition={msg.partition}", flush=True)
    time.sleep(WORK_SLEEP_S)
The signal.SIGTERM handler matters for KEDA. When KEDA scales
the Deployment down (e.g., after the topic drains), Kubernetes
sends SIGTERM to the Pod. The default Python behavior is to
ignore it for terminationGracePeriodSeconds (default 30s) and
then get killed. A graceful handler exits immediately, which
makes scale-down faster.
The Deployment + ScaledObject
The Deployment starts at replicas: 0 (the key KEDA pattern —
the Deployment is “owned” by KEDA from the moment the
ScaledObject is created):
apiVersion: apps/v1
kind: Deployment
metadata:
  name: order-processor
spec:
  replicas: 0
  selector:
    matchLabels:
      app: order-processor
  template:
    metadata:
      labels:
        app: order-processor
    spec:
      containers:
        - name: order-processor
          image: order-processor:v1
          # ... env, resources, etc.
The ScaledObject points at it:
apiVersion: keda.sh/v1alpha1
kind: ScaledObject
metadata:
  name: order-processor-scaler
spec:
  scaleTargetRef:
    name: order-processor
  pollingInterval: 5         # check Kafka every 5s
  cooldownPeriod: 30         # 30s idle → scale to 0
  minReplicaCount: 0
  maxReplicaCount: 3         # bounded by partition count
  triggers:
    - type: kafka
      metadata:
        bootstrapServers: my-kafka-kafka-bootstrap.kafka:9092
        consumerGroup: order-processor-group
        topic: orders
        lagThreshold: "5"
        offsetResetPolicy: latest
lagThreshold: "5" means one consumer replica per 5 messages of
unprocessed lag. When 50 messages pile up in the topic, KEDA
asks HPA for 10 replicas (capped at maxReplicaCount=3). When lag
drops to zero, after 30 seconds of idle, KEDA scales down to 0.
The demo run
examples/12-keda-kafka/demo.sh runs the happy path:
- Pre-flight: minikube up, KEDA installed, Strimzi installed,
my-kafkacluster Ready,orderstopic Ready - Build
order-processor:v1image (the Python consumer) - Deploy the consumer at replicas: 0
- Apply the ScaledObject
- Assert replicas = 0 (initial state)
- Produce 200 messages via
kubectl execinto the kafka pod usingkafka-console-producer.sh - Watch replica count climb (assert it goes ≥1)
- Wait for the topic to drain (consumer eats messages at 0.5s each across 3 replicas → ~33 seconds)
- Wait
cooldownPeriod + 30sfor KEDA to scale back to 0 - Assert replicas = 0 (final state)
The visible signature of success: replica count climbs from 0, peaks at some value, then drops back to 0. The demo prints the replica count at each phase for transparency.
Pattern B: HTTP request scaling with the KEDA HTTP add-on
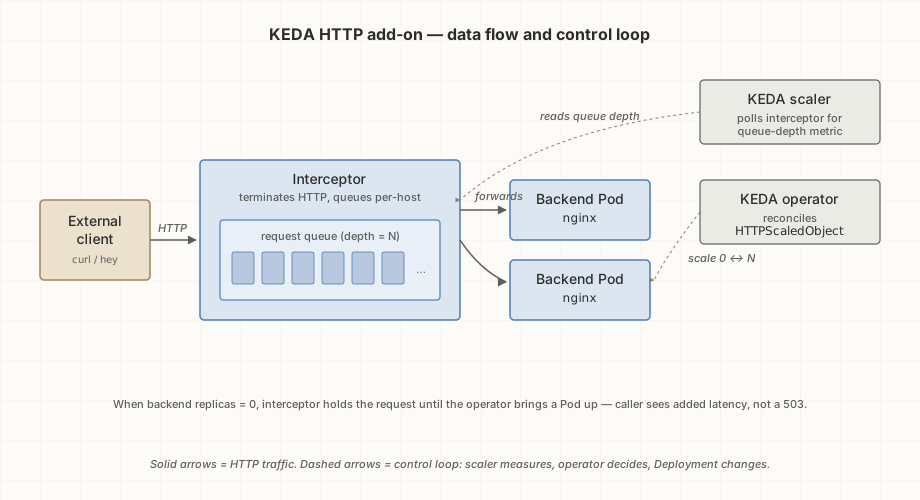
The second pattern uses the HTTP add-on instead of a built-in KEDA scaler. The shape:
- The HTTP add-on’s interceptor sits in front of the workload as a layer-7 proxy
- It counts active requests (concurrency) or queues requests when the workload is at zero replicas
- When traffic arrives, the interceptor signals KEDA to scale the workload up
- The interceptor buffers requests during cold-start so the client doesn’t see 5xx errors while the Pod is starting
Workload
Reuse nginx-custom:v1 from §6 (no need to rebuild — it’s
already cached in the minikube profile). The Deployment
manifest at examples/12-keda-http/manifests/nginx-deployment.yaml
starts at replicas: 0 and is otherwise identical to §6’s:
apiVersion: apps/v1
kind: Deployment
metadata:
  name: nginx-http
spec:
  replicas: 0
  # ... spec from §6
---
apiVersion: v1
kind: Service
metadata:
  name: nginx-http
spec:
  selector:
    app: nginx-http
  ports:
    - port: 80
      targetPort: 8080
HTTPScaledObject
The HTTP add-on uses its own CRD (not the standard
ScaledObject):
apiVersion: http.keda.sh/v1alpha1
kind: HTTPScaledObject
metadata:
  name: nginx-http-scaler
spec:
  hosts:
    - nginx.local            # any string; just matches the Host header
  scaleTargetRef:
    name: nginx-http
    kind: Deployment
    service: nginx-http
    port: 80
  replicas:
    min: 0
    max: 5
  scaledownPeriod: 30
  scalingMetric:
    concurrency:
      targetValue: 5         # 1 replica per 5 concurrent requests
scalingMetric.concurrency.targetValue: 5 means one replica
per 5 in-flight requests. With hey -c 50 (50 concurrent
connections), the HPA should ask for 10 replicas (capped at
max: 5).
Timeouts on the interceptor changed in 0.16. The scale-from-zero wait
is now interceptor.readinessTimeout (the old
interceptor.replicas.waitTimeout value is a deprecated fallback), and
the interceptor returns 504 rather than 502 when a timeout fires.
Defaults: KEDA_HTTP_READINESS_TIMEOUT is 0 (disabled, so requests wait
for the backend) and the response header timeout is 300s. The demo
relies on those defaults.
The interceptor service exposes a single endpoint
(keda-add-ons-http-interceptor-proxy.keda:8080 inside the
cluster). All HTTP traffic to scaled workloads flows through it,
keyed on the Host header.
To reach the interceptor from the host, the demo applies a
companion NodePort Service, keda-interceptor-host
(examples/12-keda-http/host-access/interceptor-host.yaml). It
selects the interceptor Pods, listens on nodePort 30080, and the
minikube profile publishes that as 127.0.0.1:18080. The Host
header carries the routing key, so requests look like
curl -H 'Host: nginx.local' http://127.0.0.1:18080/.
Shared slot. NodePort 30080 is also used by §6, §8, and §9. Only one Service can hold it at a time. Delete the §6, §8, or §9 Service first (
kubectl --context minikube delete -f ...orhelm uninstall); the demo’s preflight stops with a “delete X first” message if another Service holds the slot, and it removes its own companion Service when it exits.
The demo run
examples/12-keda-http/demo.sh:
- Pre-flight: Docker Engine,
minikubeprofile publishing nodePort 30080, KEDA + HTTP add-on installed, nodePort 30080 free docker buildnginx-custom:v1andminikube image loadit if not present (reuses §6’s Containerfile)- Apply the Deployment (replicas: 0)
- Apply the HTTPScaledObject
- Assert replicas = 0
- Apply the
keda-interceptor-hostcompanion Service (nodePort 30080 →127.0.0.1:18080) - Fire one request with
Host: nginx.localto wake the workload — interceptor should buffer until the pod is ready - Run
hey -n 500 -c 50 -host nginx.local http://127.0.0.1:18080/(note:-host, not-H, since hey is written in Go and Go’snet/httpsilently stripsHost:headers set via the headers map — see the §12 HTTP example’s README for the gotcha details) - Watch replica count climb during the load
- Wait for
scaledownPeriod + 30sof idle - Assert replicas = 0 (final state)
The first request post-scale-down is interesting to watch — it takes a few seconds because the interceptor is waiting for a Pod to come up. Subsequent requests after the Pod is ready are fast (single-digit milliseconds).
A note on observed peak replicas: in practice, on minikube with
this nginx workload, the peak is often just 1 replica even
under hey -c 50. The reason is that with nginx’s per-request
latency around 10ms, 500 requests at 50 concurrent finish in
roughly 100ms — well below the threshold to drive KEDA’s
concurrency metric past targetValue: 5 for sustained periods.
The lifecycle is still being demonstrated faithfully (0 → ≥1
→ 0), just at the lower bound. To see scaling to higher peaks,
swap -n 500 for -z 15s (run hey for 15 seconds of sustained
load); on the same minikube setup, you’ll see peak replicas of
3-5.
Cleanup
Each demo has two layers of cleanup:
demo.shcleanup trap — runs automatically on demo exit (whether the demo passed, failed, or you Ctrl-C’d it). Removes only the per-run workload (consumer / nginx) plus the ScaledObject, plus thekeda-interceptor-hostService. Leaves Kafka, Strimzi, and KEDA intact so re-runs are fastcleanup.shscript — explicit, deeper teardown. Run when you’re done with §12 (or with one of the two patterns) and want to free the resources
Tier 2 has its own options for how deep to go:
# §12 Pattern A — remove the Kafka cluster + topics + PVCs,
# keep Strimzi + KEDA installed
cd examples/12-keda-kafka && ./cleanup.sh

# §12 Pattern A — also remove Strimzi + KEDA + all their CRDs
cd examples/12-keda-kafka && ./cleanup.sh --remove-operators

# §12 Pattern B — remove nginx workload, keep KEDA
cd examples/12-keda-http && ./cleanup.sh

# §12 Pattern B — also remove KEDA + HTTP add-on
cd examples/12-keda-http && ./cleanup.sh --remove-operators
The --remove-operators flag affects both demos because they
share KEDA. If you want to remove only the HTTP add-on (e.g. to
re-run the Kafka demo without the add-on’s Pods running), use:
helm uninstall keda-add-ons-http -n keda --kube-context minikube
The minikube profile itself remains running for §6-§9 demos or anything else.
Verification: examples/12-keda-{kafka,http}/
Two independent example directories, each with its own demo:
# One-time setup (idempotent — safe to re-run)
./scripts/setup-keda.sh
./scripts/setup-strimzi.sh

# Kafka pattern: scale-from-zero on consumer lag
cd examples/12-keda-kafka
./demo.sh

# HTTP pattern: scale-from-zero on request rate (in another terminal)
cd examples/12-keda-http
./demo.sh
Both demos verify the full lifecycle: 0 replicas → traffic arrives → scale up → traffic stops → scale back to 0. The assertions are timing-based but with generous time limits, since both KEDA and Strimzi (especially the latter) can take a few extra seconds in development environments.
Total elapsed time for both demos: ~6-10 minutes for the first run (Strimzi cluster bring-up dominates), ~3-5 minutes for subsequent runs.