Istio
Service mesh on minikube — install Istio, sidecar-inject an existing Deployment, deploy Bookinfo, and exercise traffic routing and fault injection.
Everything in §6 through §10 has been about getting workloads onto Kubernetes and keeping them running. Istio is about what happens between them: how Pods talk to each other, how that traffic gets observed, how it gets shaped, and how it gets secured — all without changing application code.
This is a reference section. It’s the longest one in the tutorial, covers two distinct examples (a minimal sidecar injection of our existing nginx, then the full Istio Bookinfo sample with routing and fault injection), and uses a dedicated minikube profile to avoid stepping on §6-§9 work. By the end you’ll have:
- Istio installed on a separate
istiominikube profile - Our
nginx-custom:v1Deployment running with an Envoy sidecar - Bookinfo (4 microservices) deployed and reachable through the Istio ingress gateway
- Traffic-routing rules pinning reviews to a single version, then splitting 50/50 between two
- Fault injection slowing the ratings service
- Optional: Kiali / Prometheus / Grafana / Jaeger for visualizing the mesh
What’s a service mesh
In §6-§9, when one Pod talked to another (e.g., a Deployment of nginx serving a request that would have made an upstream call to a database, if there were one), the networking happened through kube-proxy and the Service abstraction. The application code knew nothing about retries, timeouts, mutual TLS, load-balancing strategy, or which version of an upstream it was talking to — because those concerns lived inside the application.
A service mesh moves application-level networking concerns out of the application and into a layer of infrastructure. Each Pod gets a small proxy injected as a sidecar container; the application Pod’s traffic is transparently redirected through the sidecar; and the sidecar handles mTLS, retries, routing rules, traffic splitting, observability — driven by configuration from a central control plane.
Istio is the most widely deployed service mesh. The data plane is Envoy — a high-performance proxy that runs as the sidecar in every meshed Pod. The control plane is istiod — a single binary that configures every Envoy in the mesh.
Istio architecture
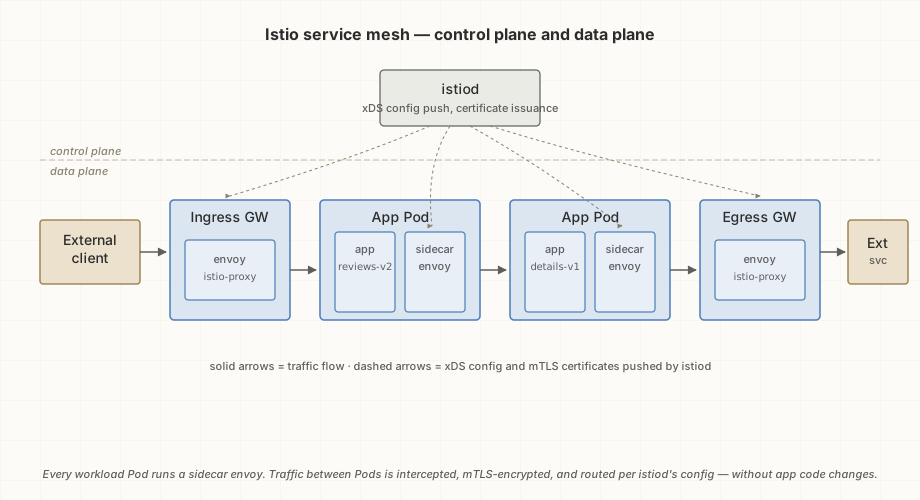
The mechanism: at Pod creation, Istio’s admission webhook injects
a second container (istio-proxy, running Envoy) and an init
container (istio-init, which uses iptables to redirect the
Pod’s traffic through Envoy). Both containers are added to the
Pod spec by the cluster, not by you. The application container
sees a regular network — but every packet in or out goes through
the sidecar.
Sidecar injection is opt-in per namespace. You label the
default namespace to enable injection, and any Pod created
there will get the sidecar automatically.
Before you start: kernel inotify limits
See §1’s “Kernel limits for multi-cluster (needed for §11)” subsection for the canonical recipe. The summary here is for readers jumping directly to §11;
scripts/audit-fedora-prereqs.shreports whether your current limits are sufficient.
minikube nodes are Docker containers that run systemd as PID 1, which
uses inotify watches for cgroup management. Fedora’s default settings are sized for one
such container — and you already have one running (the minikube
profile from §3). Starting a second cluster on the same host pushes
past the limits and the new container’s systemd fails to initialize.
The symptom looks like this during minikube start:
Failed to create control group inotify object: Too many open files
Failed to allocate manager object: Too many open files
[!!!!!!] Failed to allocate manager object.
Exiting PID 1...: container exited unexpectedly
This is not the per-process file descriptor limit (RLIMIT_NOFILE).
It’s fs.inotify.max_user_instances (a kernel sysctl). Bump it:
sysctl fs.inotify.max_user_instances fs.inotify.max_user_watches
If max_user_instances is below 256 or max_user_watches is below
131072, raise them (one-time, persistent across reboots):
sudo tee /etc/sysctl.d/99-kubernetes.conf <<EOF
fs.inotify.max_user_instances = 512
fs.inotify.max_user_watches = 524288
EOF
sudo sysctl -p /etc/sysctl.d/99-kubernetes.conf
The examples/11-istio/demo.sh pre-flight checks these values and
fails loudly with the same instructions if they’re too low — so if
you skip this section now, the demo tells you about it later.
Profile setup
Istio is heavier than anything in §6-§9. The control plane needs
~512 MB just to start; each sidecar adds another ~100 MB; the
Bookinfo sample is 12 Pods (so 12 sidecars). The default
minikube profile sized for §3 is too small.
Rather than resize the existing profile (which would force
re-deploying §6-§9 demos), §11 uses a dedicated istio
profile. Start it once:
minikube start -p istio \
    --driver=docker \
    --container-runtime=containerd \
    --kubernetes-version=v1.36.5 \
    --cpus=4 \
    --memory=6144 \
    --ports=127.0.0.1:8080:30880,127.0.0.1:20001:30201,127.0.0.1:3000:30300,127.0.0.1:19090:30990,127.0.0.1:16686:31686
The driver, runtime, and Kubernetes version are the same as §3, on a
fresh profile with more resources. --ports publishes five NodePorts
on 127.0.0.1 (the ISTIO_PORTS map in scripts/lib/_helpers.sh):
| Host | NodePort | Reaches |
|---|---|---|
127.0.0.1:8080 |
30880 | Istio ingress gateway (Bookinfo) |
127.0.0.1:20001 |
30201 | Kiali |
127.0.0.1:3000 |
30300 | Grafana |
127.0.0.1:19090 |
30990 | Prometheus |
127.0.0.1:16686 |
31686 | Jaeger |
Prometheus is on 19090, not its usual 9090: Fedora Server and RHEL
enable the Cockpit web console (cockpit.socket) on 9090 by default.
Published ports are fixed when the profile is created. If an istio
profile already exists without them, delete and recreate it:
minikube delete -p istio, then run the command above.
examples/11-istio/demo.sh creates the profile this way and stops with
the same advice if the ports are missing.
After it starts, minikube creates a kubectl context named istio.
Every command in this chapter names it explicitly with
--context istio, so the §6-§9 minikube profile is never touched
by accident. Confirm the profile and the published ports:
minikube profile list
docker port istio
minikube stop -p istio stops the istio cluster; minikube delete -p
istio removes it entirely.
Installing Istio
Istio is installed by istioctl, a CLI that ships with the Istio release tarball. The one-time setup script downloads both:
./scripts/setup-istio.sh
The script:
- Downloads
istio-1.31.1-linux-amd64.tar.gzfrom istio.io - Extracts to
~/.local/share/istio-1.31.1/ - Installs
istioctlto~/.local/bin/istioctl - Sets up a
~/.local/share/istio-currentsymlink forexamples/11-istio/demo.shto find samples
If ~/.local/bin isn’t already in your PATH, the script prints
the line to add to ~/.zshrc or ~/.bashrc.
Verify istioctl is reachable:
istioctl version --remote=false
Should print client version: 1.31.1.
Install the control plane
istioctl --context istio install --set profile=demo -y
The demo profile is what Istio’s own tutorials use — it
enables the ingressgateway and adds resources appropriate for
local experimentation. Production deployments would use a
slimmer profile (e.g., default or a custom IstioOperator).
After ~30-60 seconds:
kubectl --context istio get pods -n istio-system
NAME READY STATUS RESTARTS AGE
istio-egressgateway-... 1/1 Running 0 ...
istio-ingressgateway-... 1/1 Running 0 ...
istiod-... 1/1 Running 0 ...
Three Pods total: control plane (istiod), an ingress gateway,
and an egress gateway.
Sidecar injection
Two ways to opt a Pod into the mesh:
Namespace label (the usual way)
kubectl --context istio label namespace default istio-injection=enabled
Every Pod created in default from now on gets the
istio-proxy sidecar automatically. Existing Pods don’t — you’d
need to recreate them (e.g., kubectl --context istio rollout restart deployment/nginx).
Per-Pod annotation (override)
spec:
template:
metadata:
annotations:
sidecar.istio.io/inject: "true" # force inject (or "false" to opt out)
The annotation overrides the namespace label. Useful when you want injection only for a specific Deployment, or want to exclude a Pod from injection in an otherwise meshed namespace.
Sidecar in action — our nginx, now with Envoy
examples/11-istio/manifests/nginx-with-sidecar.yaml:
apiVersion: apps/v1
kind: Deployment
metadata:
name: nginx-istio
labels:
app: nginx-istio
spec:
replicas: 2
selector:
matchLabels:
app: nginx-istio
template:
metadata:
labels:
app: nginx-istio
annotations:
sidecar.istio.io/inject: "true"
spec:
containers:
- name: nginx
image: nginx-custom:v1
imagePullPolicy: IfNotPresent
ports:
- containerPort: 8080
readinessProbe:
httpGet:
path: /
port: 8080
initialDelaySeconds: 2
periodSeconds: 5
---
apiVersion: v1
kind: Service
metadata:
name: nginx-istio
spec:
type: ClusterIP
selector:
app: nginx-istio
ports:
- port: 80
targetPort: 8080
Same image as §6 (the demo rebuilds it and loads it into this
profile with docker build and minikube image load; images don’t
cross profiles), same Deployment shape with the
mesh-injection annotation added. The Service is plain ClusterIP
— Istio’s sidecars provide mTLS between meshed Pods regardless
of Service type.
Apply:
kubectl --context istio apply -f examples/11-istio/manifests/nginx-with-sidecar.yaml
Watch:
kubectl --context istio get pods -l app=nginx-istio
NAME READY STATUS RESTARTS AGE
nginx-istio-xxxxxxx-aaaaa 2/2 Running 0 12s
nginx-istio-xxxxxxx-bbbbb 2/2 Running 0 12s
READY 2/2 — that’s the key visual indicator. The Pod now has
two containers contributing to its readiness: the nginx
application and the istio-proxy Envoy sidecar.
Sidebar: native sidecars. Where istio-proxy lives in the Pod spec depends on the Kubernetes version. Kubernetes 1.28+ with Istio 1.29+ (your situation) uses native sidecars (KEP-753): the sidecar is an init container with
restartPolicy: Alwaysrather than a main container. Two practical consequences:
kubectl get podsstill shows2/2— the Kubernetes readiness accounting counts native sidecars in the totals- JSONPath queries against
.status.containerStatuses[]will NOT find istio-proxy. It’s in.status.initContainerStatuses[], or.spec.initContainers[]on the spec sideIf you want to verify injection in a script, look at both
.spec.containers[*].nameand.spec.initContainers[*].nameforistio-proxy. The §11 demo does this. On pre-1.28 Kubernetes, istio-proxy is still injected as a main container; the demo’s spec-based check handles both modes.
kubectl describe pod confirms the layout — note where
istio-proxy appears:
Init Containers:
istio-init:
Image: docker.io/istio/proxyv2:1.31.1
State: Terminated (Completed)
Restart Count: 0
...
istio-proxy:
Image: docker.io/istio/proxyv2:1.31.1
State: Running
Restart Policy: Always ← this makes it a native sidecar
...
Containers:
nginx:
Image: nginx-custom:v1
State: Running
...
The istio-init init container runs once (sets up iptables to
redirect traffic through Envoy), exits. istio-proxy runs for
the Pod’s lifetime — listed under “Init Containers” because it
runs init-first, but with restartPolicy: Always so it never
“completes” the way a normal init container does.
Inspecting the sidecar
Useful istioctl commands:
POD=$(kubectl --context istio get pod -l app=nginx-istio -o jsonpath='{.items[0].metadata.name}')
# What Envoy clusters does this Pod know about?
istioctl --context istio proxy-config clusters "$POD"
# What listeners?
istioctl --context istio proxy-config listeners "$POD"
# What route rules?
istioctl --context istio proxy-config routes "$POD"
# Cluster-wide sanity check
istioctl --context istio analyze
These get more interesting once Bookinfo’s routing rules are in place. For now, just knowing the commands exist is enough.
Bookinfo
Bookinfo is Istio’s canonical sample application: a four-service microservices app written in four languages, designed to exercise the interesting parts of a service mesh.
Architecture:
┌─────────────┐
│ productpage │ Python — the frontend
│ (port 9080)│
└──┬───────┬──┘
│ │
│ └────────────┐
▼ ▼
┌─────────┐ ┌─────────────────────┐
│ details │ │ reviews │
│ (Ruby) │ │ (Java; v1, v2, v3) │
└─────────┘ └──────────┬──────────┘
│
▼ (v2 + v3 only)
┌─────────────┐
│ ratings │
│ (Node.js) │
└─────────────┘
Three versions of reviews give Istio something to route
between:
- v1 — no ratings stars
- v2 — black ratings stars (calls
ratings) - v3 — red ratings stars (calls
ratings)
By default, traffic round-robins across all three; later steps add rules that pin or split.
Deploy
kubectl --context istio apply -f ~/.local/share/istio-current/samples/bookinfo/platform/kube/bookinfo.yaml
(istio-current is the symlink the setup script created.)
About 12 Pods come up — productpage, details, ratings, and three reviews versions, each with 2 containers (app + sidecar). Give it 1-2 minutes.
kubectl --context istio get pods
kubectl --context istio get svc
Expose via the ingress gateway
bookinfo-gateway.yaml creates a Gateway (which configures
the ingress gateway to listen on a host/port) and a
VirtualService (which routes traffic from the Gateway to the
productpage Service):
kubectl --context istio apply -f ~/.local/share/istio-current/samples/bookinfo/networking/bookinfo-gateway.yaml
Verify config is clean:
istioctl --context istio analyze
Reaching Bookinfo
The istio profile publishes NodePort 30880 on 127.0.0.1:8080, but
the upstream istio-ingressgateway Service is a LoadBalancer with
its own ports. A companion NodePort Service owned by this repo
selects the same gateway Pods and listens on 30880, so
istioctl install never reverts it:
kubectl --context istio apply -f examples/11-istio/host-access/ingressgateway-host.yaml
Then:
curl http://127.0.0.1:8080/productpage
Open the same URL in a browser for the rendered page. If the curl
gets no answer, check docker port istio 30880/tcp: an empty result
means the profile was created without --ports, and the fix is to
recreate it (see Profile setup).
Refresh the page a few times. The reviews section cycles through three versions (no ratings, black stars, red stars) because the default routing is round-robin.
Traffic management
This is where Istio earns its keep. The samples/bookinfo/networking/
directory has manifests for the common patterns.
Pin everything to v1
First, define DestinationRules that name the three subsets of
the reviews Service:
kubectl --context istio apply -f ~/.local/share/istio-current/samples/bookinfo/networking/destination-rule-all.yaml
Then a VirtualService that sends 100% of reviews traffic to
v1:
kubectl --context istio apply -f ~/.local/share/istio-current/samples/bookinfo/networking/virtual-service-all-v1.yaml
Refresh the productpage a few times. The reviews section is now always no-ratings (v1). The other versions are still running — they’re just not getting traffic.
50/50 between v1 and v3
kubectl --context istio apply -f ~/.local/share/istio-current/samples/bookinfo/networking/virtual-service-reviews-50-v3.yaml
Refresh a dozen times. Roughly half show no ratings (v1), half show red stars (v3). This is the canary release pattern: deploy v3 alongside v1, route a fraction of traffic to it, watch the metrics, gradually shift more traffic.
Fault injection
Istio can synthesize problems for testing — useful for verifying that your app handles upstream failures gracefully.
Add a 7-second delay to all calls hitting ratings:
kubectl --context istio apply -f ~/.local/share/istio-current/samples/bookinfo/networking/virtual-service-ratings-test-delay.yaml
Refresh the productpage. The ratings panel takes 7 seconds to appear (or times out and shows an error, depending on the productpage’s timeout). The slowness is synthetic, configured in Istio, not actually slow code.
Other patterns the same directory has manifests for (worth exploring on your own):
- HTTP 500 abort injection
- Header-based routing (route different users to different versions)
- Timeouts and retries
Observability: the addons
Istio doesn’t include Kiali / Prometheus / Grafana / Jaeger by default, but ships sample manifests for them. Apply the addons, then the companion NodePort Services that put each UI on a published host port:
kubectl --context istio apply -f ~/.local/share/istio-current/samples/addons/
kubectl --context istio apply -f examples/11-istio/host-access/
The addons take about 5 minutes to come up. Then open:
| UI | URL |
|---|---|
| Kiali | http://127.0.0.1:20001/kiali |
| Grafana | http://127.0.0.1:3000 |
| Prometheus | http://127.0.0.1:19090 |
| Jaeger | http://127.0.0.1:16686/jaeger/ |
(host-access/ also holds ingressgateway-host.yaml; applying it
again is harmless.)
The most useful Kiali view is the service graph — visualize the entire mesh as a directed graph of Services, with live traffic rates and golden signals on each edge. The current routing rules show up as colored edges (green for healthy, red for errors). Apply the 50/50 split rule and you’ll see the traffic visibly diverge in real time.
Grafana carries pre-built Istio dashboards, Prometheus answers raw metric queries, and Jaeger shows distributed traces.
The addons are not part of the §11 demo because they take 5+
minutes to come up and aren’t critical for the routing exercises.
Install them when you want the visual feedback; uninstall with
kubectl --context istio delete -f ~/.local/share/istio-current/samples/addons/
and kubectl --context istio delete -f examples/11-istio/host-access/.
Exploring with Kiali after the demo
Two practical notes for anyone who wants to spend time in Kiali
visualizing the mesh after the demo.sh run completes:
The demo’s cleanup trap deletes Bookinfo on exit. This is by
design — demo.sh is idempotent, leaves no leftover state on
the istio profile, and any subsequent run starts fresh.
But it means the productpage and the routing rules are gone
the moment the demo finishes. If you open Kiali immediately
after a ✓ SUCCESS run, you’ll see the mesh control plane
(istio-ingressgateway, istiod, the gateways) but no application
traffic to graph, and a request to 127.0.0.1:8080 will fail with “connection refused” because no
Gateway resource is configured to make Envoy bind to port 8080.
To explore Kiali with a live mesh, redeploy Bookinfo manually after the demo runs:
ISTIO_DIR=~/.local/share/istio-current
# Redeploy the workload + Gateway + DestinationRules
kubectl --context istio apply -f $ISTIO_DIR/samples/bookinfo/platform/kube/bookinfo.yaml
kubectl --context istio wait --for=condition=Available --timeout=180s \
deployment/productpage-v1 deployment/details-v1 deployment/ratings-v1 \
deployment/reviews-v1 deployment/reviews-v2 deployment/reviews-v3
kubectl --context istio apply -f $ISTIO_DIR/samples/bookinfo/networking/bookinfo-gateway.yaml
kubectl --context istio apply -f $ISTIO_DIR/samples/bookinfo/networking/destination-rule-all.yaml
Now Bookinfo is running independently of the demo. Install the observability addons (Kiali / Prometheus / Grafana / Jaeger / Loki) which the demo deliberately doesn’t install — they take 3-5 minutes to come up and aren’t required for the routing assertions:
kubectl --context istio apply -f $ISTIO_DIR/samples/addons/
kubectl --context istio apply -f examples/11-istio/host-access/
kubectl --context istio wait --for=condition=Available --timeout=300s \
deployment/kiali deployment/prometheus deployment/grafana deployment/jaeger \
-n istio-system
Generate some traffic so Kiali has data to graph:
for i in {1..200}; do curl -s http://127.0.0.1:8080/productpage >/dev/null; sleep 0.15; done
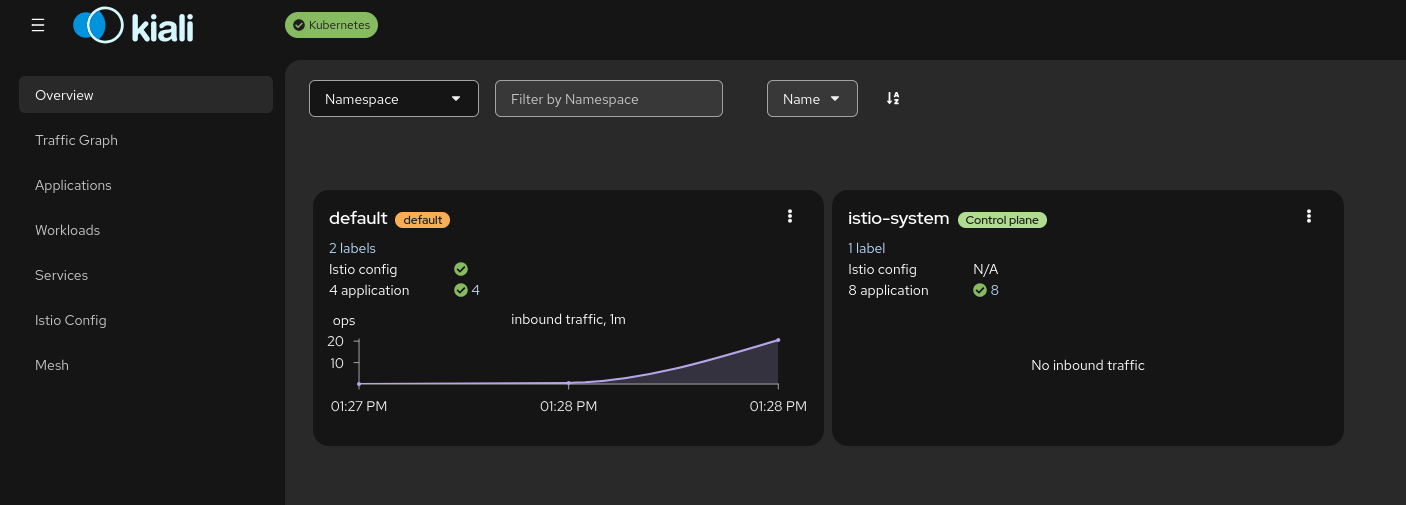
Open http://127.0.0.1:20001/kiali/ in a browser. The
Overview page shows namespace cards with live inbound
traffic rates per namespace. The default namespace card should
show 4 application (productpage, details, ratings, reviews)
with a climbing inbound-traffic sparkline as the curl loop
runs:
Navigate to Traffic Graph → Namespace: default for the mesh visualization. With Display → Traffic Animation turned on, you see animated dots traveling along the edges between services — individual requests flowing through the mesh in near-real time. Green edges are healthy (100% success); errors and slowdowns show as yellow or red:
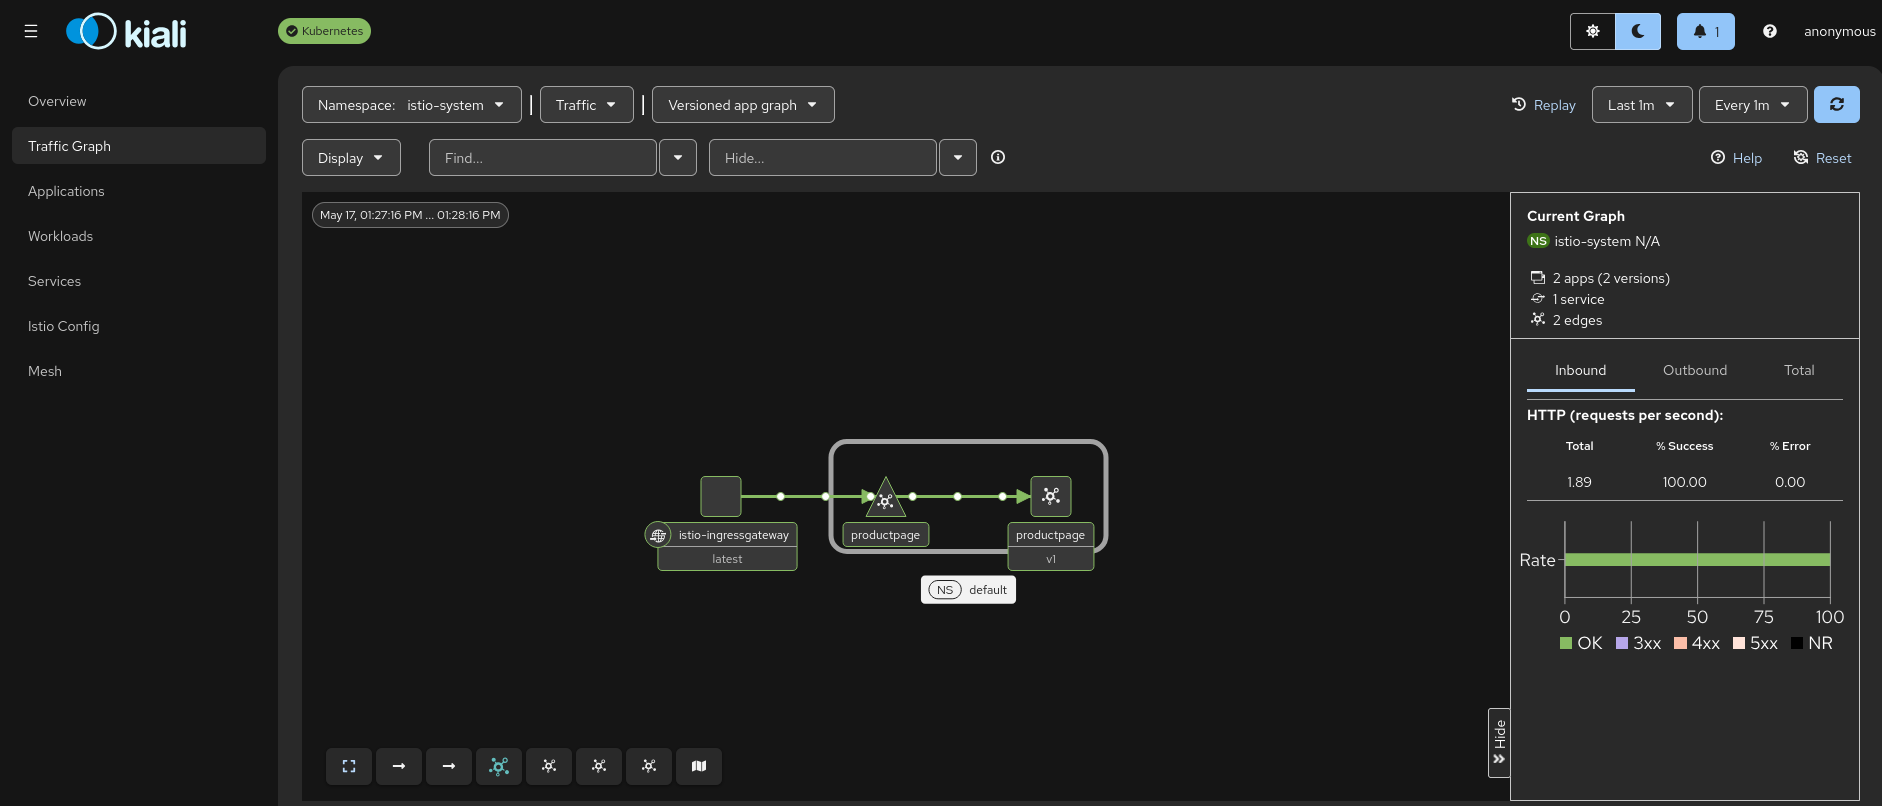
The right-hand panel shows aggregate stats for the selected
subgraph — requests/second, success rate, error rate, and a
histogram of HTTP status codes. Switch namespaces in the
dropdown (from istio-system to default) to see the full
bookinfo call graph: productpage as the hub, branching to
details and reviews, with reviews further branching to ratings.
A few interactive demonstrations worth trying in Kiali while it’s open:
- Apply v1 pinning in another terminal:
kubectl --context istio apply -f $ISTIO_DIR/samples/bookinfo/networking/virtual-service-all-v1.yaml for i in {1..100}; do curl -s http://127.0.0.1:8080/productpage >/dev/null; sleep 0.1; doneKiali’s graph redraws within 10-15 seconds. Traffic now flows exclusively to
reviews-v1;reviews-v2andreviews-v3either drop off entirely or appear greyed out - Apply fault injection to see what unhealthy looks like:
kubectl --context istio apply -f $ISTIO_DIR/samples/bookinfo/networking/virtual-service-ratings-test-delay.yaml for i in {1..50}; do curl -s -o /dev/null http://127.0.0.1:8080/productpage; doneThe ratings edge goes yellow or red as Kiali notices the 7s artificial delay. Refresh productpage in a browser — the ratings panel takes seven seconds to render
- Other dashboards are one URL each:
- Grafana at
http://127.0.0.1:3000— pre-built dashboards for mesh metrics - Jaeger at
http://127.0.0.1:16686/jaeger/— distributed traces of productpage requests through the call graph - Prometheus at
http://127.0.0.1:19090— raw metrics queries, for the curious
- Grafana at
This is the moment §11 stops being abstract: every Service-to- Service call you’ve configured through DestinationRule and VirtualService is happening in front of you, with live telemetry, mTLS, and request-level observability — all without any application code knowing the mesh exists.
When you’re done exploring, remove the addons (they’re heavy and not needed for §12 or anything later in the tutorial):
kubectl --context istio delete -f examples/11-istio/host-access/
kubectl --context istio delete -f $ISTIO_DIR/samples/addons/
This keeps Istio itself installed; just removes the four observability tools. To also clean up the manually-redeployed Bookinfo:
kubectl --context istio delete -f $ISTIO_DIR/samples/bookinfo/networking/
kubectl --context istio delete -f $ISTIO_DIR/samples/bookinfo/platform/kube/bookinfo.yaml
The rest of the tutorial uses the minikube profile; nothing in
this chapter changed your current kubectl context, so there is
nothing to switch back.
Cleanup
The §11 demo’s trap cleans up Bookinfo, the nginx Deployment, and the routing rules. To uninstall Istio itself:
istioctl --context istio uninstall --purge -y
kubectl --context istio delete namespace istio-system
kubectl --context istio label namespace default istio-injection-
To stop the istio profile:
minikube stop -p istio
Or delete it entirely:
minikube delete -p
istio
Verification: examples/11-istio/
examples/11-istio/demo.sh runs the §11 happy path:
- Pre-flight: Docker Engine reachable; istio profile up with its
published NodePorts; every call pinned to the
istiocontext; istioctl in PATH; ISTIO_DIR symlink exists docker buildnginx-custom:v1andminikube image loadit into the istio profile (image cache doesn’t carry across profiles)- Install Istio if not already installed (
istioctl install) and apply theingressgateway-hostcompanion Service - Label
defaultnamespace for injection - Deploy our nginx-with-sidecar; verify 2/2 containers
- Deploy Bookinfo; wait for all Pods to be Ready
- Apply the Gateway + VirtualService
- Curl
http://127.0.0.1:8080/productpage(NodePort 30880); verify the response contains expected markers (e.g. the “Bookinfo Sample” heading) - Apply destination rules + all-v1 routing; curl productpage N times; verify no v2/v3 stars appear
- Apply 50/50 split; curl productpage 20 times; count how
many responses contain
glyphicon-star(v3) — should be roughly 8-12 of 20 if split is working - Cleanup all bookinfo and nginx resources on exit (trap)
The demo pins --context istio on every call, so your current kubectl
context is never changed.
cd examples/11-istio
./demo.sh
Expected duration: 5-10 minutes for the full run. Most of it
is Bookinfo Pod startup and waiting for sidecars to be ready.
First run after setup-istio.sh adds 2-4 minutes for the
nginx-custom image build and load on the new profile.
This is the longest single demo in the tutorial. The phases are idempotent — re-running picks up where the cluster state left off.