Local with Docker Compose
The tracking view as one local tier: an nginx edge that terminates TLS 1.3, caps request bodies and routes only /graphql, an internal backend network, configuration and secrets kept outside the images, health-ordered start, resource limits, restart and shutdown settings, and a request followed from the edge to its trace and its log record.
Chapters 3 to 24 each ran one example. A chapter brought up the two stacks it needed, read a few responses with curl and tore everything down. That is the right size for learning one technique and the wrong size for answering a different question: what does the service look like when it runs as a whole? Something has to terminate TLS, something has to refuse a body that is too large, the service has to start after the things it depends on, and an operator has to be able to read what the engine was told to do. None of that is GraphQL, and all of it decides whether the GraphQL service is reachable and diagnosable.
The code is in examples/25-docker-compose/. It starts from the production instances of Chapter 24: Chapter 19’s telemetry and extensions.traceId on every execution error. It leaves out that chapter’s seeded fault, its development instances and its run-time level switch, because a tier runs the service as it ships. The schema is the same slice as Chapters 19 and 24, everything except Subscription, so the SDL does not change. Around it are four services: an nginx edge, the two stacks and the observability backend. verify.sh brings them up and reads the result from the outside.
From one example to a tier
Figure 25.1 shows the project. Four services run on three networks. The two stacks have no published port. The only way to reach them from the host is the edge, which publishes 8350 for Quarkus and 8351 for Python, both over TLS. The observability backend publishes Grafana, Tempo, Prometheus and Loki on 8352 to 8355, bound to 127.0.0.1 so they are reachable from the machine and from nowhere else.
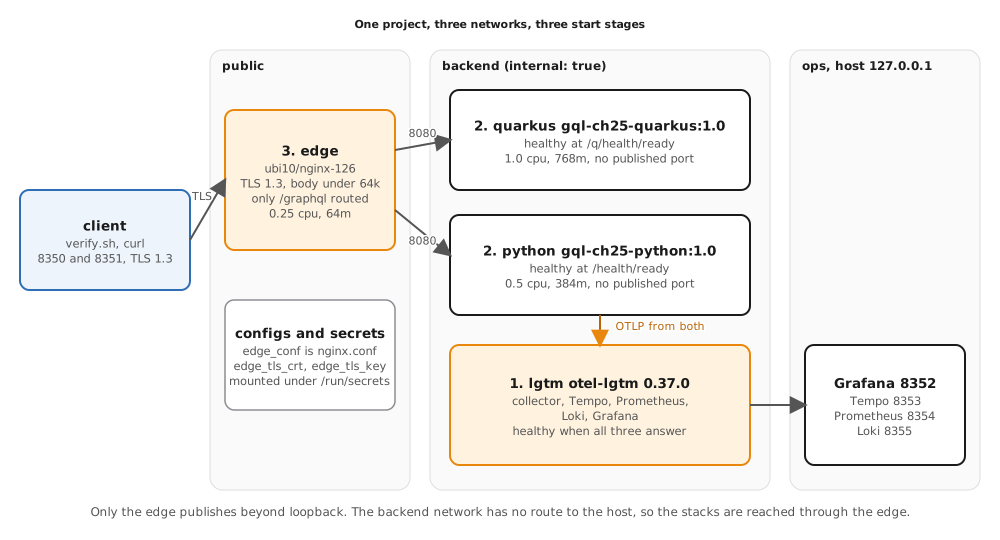
The three networks do different jobs. public carries the edge’s published listeners. ops carries the observability backend’s. backend is declared internal: true, which gives it no route to or from the host: the edge, both stacks and lgtm join it, and traffic between them stays on it. The edge joins public and backend, the stacks join backend only, and lgtm joins backend and ops.
networks:
  public: {}
  ops: {}
  backend:
    internal: true
A network that is internal protects a service by making the wrong path impossible, and that is a stronger statement than a service that merely does not listen on a public address. A stack that later gains a debug route, a metrics endpoint or an administrative page does not become reachable from the host by accident, because it has no address there. Anything an operator needs is reached by an explicit step: an exec into the container, or a route added to the edge. verify.sh takes the first step for the lab endpoints, with compose_exec_http, which runs curl inside the container against localhost:8080.
Start order follows from what each service needs. The stacks export telemetry, so they wait for lgtm. The edge proxies to both stacks, so it waits for both. Compose expresses each wait as a depends_on entry with condition: service_healthy, which is a statement about health and not about the container merely having started:
    depends_on:
      quarkus:
        condition: service_healthy
      python:
        condition: service_healthy
docker compose up -d --wait returns once every service is healthy. That is why verify.sh calls it after the harness’s own up: the first returns when the edge has started, the second when it answers.
Nothing in the tier is specific to this chapter’s data. Replace the two images with another service that exposes a health endpoint on 8080 and the edge, the networks, the configs and the secrets work the same way. That is the reason to build a tier as its own example instead of folding it into a feature chapter: the parts that are not GraphQL are reusable, and they are easier to read without a feature in the way.
One image per stack
Each stack is built once and tagged 1.0: gql-ch25-quarkus:1.0 and gql-ch25-python:1.0. The compose file sets image: beside build:, so the tag a build produces is the tag of the image the stack runs. A fixed tag is what lets Chapter 26 take the same two images, load them into a cluster and deploy them unchanged. An image that is rebuilt for each environment is not the thing that was tested.
The Containerfiles change in three ways from Chapter 24. The Quarkus file loses its dev target, since a tier has no development instance. The Python entrypoint gains --timeout-graceful-shutdown 10, which gives uvicorn ten seconds to finish requests in flight after a stop signal. And each image names its service for the collector: ch25-compose-quarkus and ch25-compose-python. Nothing else about the application depends on where it runs.
Configuration outside the image
The images carry no environment-specific value. Everything a tier supplies reaches the process through its environment or through a mounted file, which is the Twelve-Factor App’s rule for config and the reason one image runs on a laptop and in a cluster.
The contract is small. Each stack has an env_file with the values that are part of the tier, and an environment: list with the ones a run may override:
| Name | Stack | Meaning |
|---|---|---|
OTEL_EXPORTER_OTLP_ENDPOINT |
both | the collector, http://lgtm:4317 |
QUARKUS_OTEL_SERVICE_NAME |
Quarkus | quarkus.otel.service.name, ch25-compose-quarkus |
OTEL_SERVICE_NAME |
Python | the service name, ch25-compose-python |
TRACKING_SOURCE_LATENCY_MS |
both | the lab delay per source call, 250 unless the shell sets it |
TRACKING_DEBUG_ENDPOINTS |
both | the lab source-call log; the edge does not route it |
Quarkus maps an environment name to a configuration property by a fixed rule, so QUARKUS_OTEL_SERVICE_NAME sets quarkus.otel.service.name without any entry in application.properties naming it. The Python side reads the TRACKING_ names through pydantic-settings and the OTEL_ names through the OpenTelemetry SDK. The same keys will appear in a Kubernetes ConfigMap in Chapter 26, and nothing in the application changes.
${VAR:-default} supplies a default that a shell can replace. The file uses it for the latency, ${TRACKING_SOURCE_LATENCY_MS:-250}, and for the directory that holds the certificate, ${CERT_DIR:-./certs}.
A file is configuration too. The edge’s nginx.conf is a compose config:
    configs:
      - source: edge_conf
        target: /etc/nginx/nginx.conf
configs:
  edge_conf:
    file: ./edge/nginx.conf
A configs: entry mounts the file read-only at the target path. The image’s own nginx.conf is replaced, the image itself is untouched, and a change to the file takes effect on the next up.
Secrets as files
The edge needs a certificate and a private key. The key is the only secret in the tier, and the tier treats it the way a platform would: as a file the process reads, never as a value in an environment or an image layer.
    secrets:
      - edge_tls_crt
      - edge_tls_key
secrets:
  edge_tls_crt:
    file: ${CERT_DIR:-./certs}/edge.crt
  edge_tls_key:
    file: ${CERT_DIR:-./certs}/edge.key
Each secret appears in the container as a read-only file under /run/secrets/, named for the secret. gen-certs.sh writes a throwaway certificate authority, a server certificate for localhost, edge and 127.0.0.1, and the key, all valid for two days. verify.sh runs it into a scratch directory, sets CERT_DIR to that directory and sets LGTM_CACERT to the CA, so every harness call trusts it. Nothing it writes is committed, and certs/ is in .gitignore.
Compose mounts a file secret from its host path, so the file keeps its host mode. The key belongs to a two-day certificate from a throwaway CA and exists only in the run’s scratch directory. A real deployment sources the key from a secret store, with a mode its platform sets.
The claim to check is what is absent. verify.sh reads the edge’s environment from the engine and finds neither a PEM header nor the key’s body. It searches docker inspect of the container and docker inspect plus docker history of all three images for the same text. The key is in one place, the file, and the check proves it by looking in the others.
The edge
The edge is nginx on ubi10/nginx-126, pinned to 10.2-1791973310. It does four jobs, each of them a line or two of configuration. Chapter 17 said a reverse proxy can terminate TLS and that the production answer to a large body is client_max_body_size at the proxy. This is that proxy.
    ssl_protocols       TLSv1.3;
    ssl_certificate     /run/secrets/edge_tls_crt;
    ssl_certificate_key /run/secrets/edge_tls_key;

    client_max_body_size 64k;
TLS 1.3 is the only protocol the listeners accept. A client that offers 1.2 fails the handshake before any HTTP happens. The body limit is checked against the request’s Content-Length, so a body over 64k is answered 413 before nginx reads it and before a backend is involved. Chapter 17 sent a 100 KB comment inside a valid query; the same body is the case here, and the stacks never see it.
Only one path is routed. Everything else is answered by the edge:
    server {
        listen 8443 ssl;
        server_name localhost;

        location = /graphql {
            set $backend http://quarkus:8080;
            proxy_pass $backend;
        }
        location / {
            return 404;
        }
    }
location = /graphql matches that path exactly. The lab source-call log, the Quarkus health endpoints, the Python health routes and the site root answer 404 at the edge, which is the point of keeping them: they exist inside the network for the platform and for verify.sh; an outside caller never reaches them. A second server block listens on 8444 for Python, so each stack has its own listener and the chapter’s port rule holds.
The backend is the upstream: nginx’s name for the server a proxy_pass points at. The edge resolves each upstream through the network’s DNS, so a restarted container is found at its new address. Two lines do it. A resolver directive names Docker’s embedded DNS server and how long an answer lives, and a variable in proxy_pass makes nginx resolve the name per request instead of once at start-up:
resolver 127.0.0.11 valid=10s;
            set $backend http://quarkus:8080;
            proxy_pass $backend;
The proxy settings above the server blocks forward what a GraphQL service needs. Host and X-Forwarded-For pass through, X-Forwarded-Proto says https, and a map turns an Upgrade header into a Connection: upgrade, which a WebSocket handshake needs and Chapter 27 uses. The trace headers need no line at all: nginx passes request headers unchanged, so traceparent and tracestate reach the backend as the client sent them. The access log records the traceparent, so an edge log line and a trace can be matched.
The image runs as UID 1001, which cannot write /var/log/nginx or /run. The configuration moves the pid file and every temporary path under /tmp and writes both logs to the standard streams, which is also where a log driver reads them.
docker compose logs edge prints one line per request with the status, the chosen upstream and the traceparent, and Grafana on http://localhost:8352 opens with Tempo, Prometheus and Loki already configured as data sources. A trace id copied from an edge log line pastes straight into Tempo’s search, which makes the edge the first place a support question starts and the trace the second.
Health and start order
A health check turns “the process started” into “the process can serve”. The two stacks express it differently and the tier reads both the same way.
Quarkus uses SmallRye Health, which exposes three endpoints under /q/health: started once the application has booted, ready when it can take requests and live while the process is sound. The compose healthcheck calls ready. Python gets the same split from two plain FastAPI routes:
@app.get("/health/live", tags=["ops"])
def live() -> dict[str, str]:
    return {"status": "UP"}


@app.get("/health/ready", tags=["ops"])
def ready(request: Request, response: Response) -> dict[str, str]:
    if not request.app.state.ready:
        response.status_code = status.HTTP_503_SERVICE_UNAVAILABLE
        return {"status": "DOWN"}
    return {"status": "UP"}
live answers 200 for as long as the process answers at all. ready answers 503 until the lifespan has built the handling store and the sources and set app.state.ready. On a stop signal uvicorn closes its listening socket first, so new requests, health checks included, are refused while the ones in flight finish. The lifespan is FastAPI’s hook for start-up and shutdown work, so the flag changes in the place where the work happens.
The two answers mean different things to an orchestrator. A failed liveness check means the process is stuck and a restart may help. A failed readiness check means the process is working and should receive no traffic yet. Chapter 26 maps started, ready and live to a Kubernetes startup, readiness and liveness probe, and the Python pair to the last two.
    healthcheck:
      test: ["CMD", "curl", "-fsS", "-o", "/dev/null", "http://localhost:8080/health/ready"]
      interval: 5s
      timeout: 3s
      retries: 20
      start_period: 10s
start_period is a grace window in which a failing check does not count against retries. The JVM needs longer than the Python process, so Quarkus has 20s and Python 10s. The edge’s own check is a real GraphQL request: a POST of { __typename } to its own listener, verified against the certificate mounted as a secret. That makes it healthy only when TLS, the config and the route all work.
Limits, restarts and shutdown
A tier that runs on a shared machine states what each service may use and what happens when it stops. Each application service carries the same four settings from a shared block:
x-app: &app
  restart: unless-stopped
  stop_grace_period: 15s
  logging:
    driver: local
    options:
      max-size: "10m"
      max-file: "3"
  networks:
    - backend
restart: unless-stopped has the engine start a container again when its process exits, unless a person stopped it. stop_grace_period is how long the engine waits between the stop signal and a kill. The local log driver stores each service’s output on the host with rotation, 10m in at most three files, so a chatty service cannot fill the disk. Limits sit beside them under deploy.resources.limits:
| Service | CPU | Memory |
|---|---|---|
| quarkus | 1.0 |
768m |
| python | 0.5 |
384m |
| edge | 0.25 |
64m |
Compose turns each into an engine setting, NanoCpus and Memory, and verify.sh reads them back from the engine instead of trusting the file: 805306368 bytes and 1000000000 nano-CPUs for Quarkus, 402653184 and 500000000 for Python. The same read checks the restart policy name, the log driver and its rotation, and the stop timeout of 15. A configuration the engine did not apply is the kind of mistake a re-read catches and a code review does not.
The stop grace period only helps if the application uses it. Each stack sets a shutdown window shorter than the grace period:
quarkus.shutdown.timeout=10s
ENTRYPOINT ["opentelemetry-instrument", "uvicorn", "app.main:app", "--host", "0.0.0.0", "--port", "8080", \
            "--timeout-graceful-shutdown", "10"]
On SIGTERM Quarkus stops accepting new requests and waits up to that long for the ones in flight. Uvicorn’s --timeout-graceful-shutdown 10 does the same for Python. Both windows end before the engine’s fifteen seconds, so the process leaves by itself and is not killed in the middle of a response. The JVM then exits with 143, 128 plus the number of SIGTERM, after its shutdown hooks have run; a kill at the end of the grace period would show 137. The figures follow the Twelve-Factor App’s idea of disposability: fast start, graceful stop.
Two cases in verify.sh exercise it. In the first, verify.sh sends SIGTERM to the Python process from inside its container, so the process exits without a stop request to the engine, and the restart policy brings it back with no compose up. A docker compose stop or kill is an operator’s request, and unless-stopped leaves that container stopped. In the second a FanOut, which takes more than a second at 250 ms per source call, is sent to Quarkus; once its first source call shows in the log the service is stopped, and the response must still arrive complete.
The diagnosis path on the whole stack
Chapter 24 ended with a path from a response to its cause. The tier gives that path a full environment: the service runs behind the edge and exports to lgtm, so the path starts where a client would start it.
Figure 25.2 follows one request. The client sends ListCargos, cargos(first: 10), to the edge with a traceparent it chose. The edge terminates TLS, checks the body and the path, and passes the header on. The stack answers with six edges. Five nodes resolve, and the node of GHI345 is null with an error whose code is SERVICE_UNAVAILABLE, because the booking source fails that key. The error carries extensions.traceId, and the value is the trace id of the traceparent the client sent.
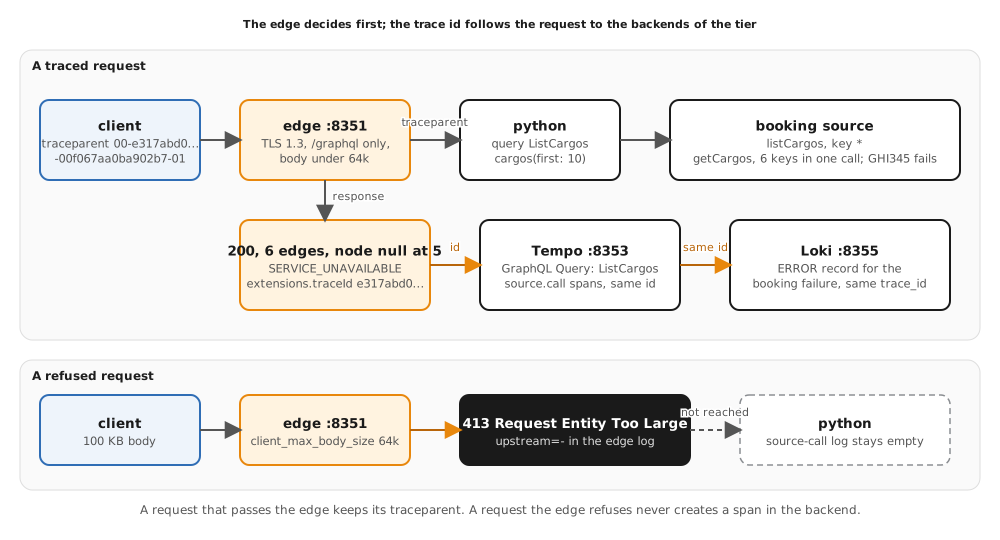
Two things travel with that id. Tempo holds the trace under it, with the operation span GraphQL Query: ListCargos on Python and query ListCargos on Quarkus, and below it the source.call spans of the two booking calls. Loki holds the exception record the server wrote when the failure passed through the engine, with trace_id as structured metadata, so {service_name="ch25-compose-python"} | trace_id="<id>" returns it. The two stacks fail differently, as Chapter 13 recorded: Quarkus nulls the whole batch and reports six errors, one per parent, and Python reports one. Both stacks give the same answer at the trace id.
The comparison shows what the edge adds. The path from a response to a cause now crosses a proxy, and the proxy must not break it. Because nginx forwards traceparent, the trace begins at the caller and continues in the backend, with no new header to learn and no second id to correlate. verify.sh asserts it: the id it sent is the id in the error, the id in Tempo and the id in Loki.
The lower band of the figure is the refused request. A 100 KB body is answered 413 by the edge. The stack’s source-call log is empty afterwards, so no resolver ran, and the edge’s access log records the request with upstream=-, which means no upstream was chosen. A refusal at the edge is cheaper than a refusal in the application, because it never costs a thread, a parse or a trace.
On the wire
Generate the throwaway certificates, start the tier and wait for every service to be healthy:
examples/25-docker-compose/gen-certs.sh examples/25-docker-compose/certs
docker compose -f examples/25-docker-compose/compose.yaml up -d --build --wait
Send a traced request through the edge to the Python stack, with the CA that signed the edge’s certificate:
CA=examples/25-docker-compose/certs/ca.crt
TID=$(python3 -I -c 'import secrets; print(secrets.token_hex(16))')
curl -s --cacert $CA https://localhost:8351/graphql -H 'Content-Type: application/json' \
  -H "traceparent: 00-$TID-00f067aa0ba902b7-01" \
  -d '{"query":"query ListCargos { cargos(first: 10) { totalCount edges { node { trackingId } } } }"}'
{"data":{"cargos":{"totalCount":6,"edges":[{"node":{"trackingId":"VWX901"}},{"node":{"trackingId":"XYZ789"}},{"node":{"trackingId":"STU678"}},{"node":{"trackingId":"DEF456"}},{"node":{"trackingId":"ABC123"}},{"node":null}]}},"errors":[{"message":"booking service unavailable","locations":[{"line":1,"column":59}],"path":["cargos","edges",5,"node"],"extensions":{"code":"SERVICE_UNAVAILABLE","traceId":"e317abd0a65a4ba25a30bfb67ccda8fb"}}]}
The traceId equals $TID. Read the trace from Tempo, and the record from Loki by the same id:
curl -s localhost:8353/api/traces/$TID
curl -sG localhost:8355/loki/api/v1/query_range \
  --data-urlencode "query={service_name=\"ch25-compose-python\"} | trace_id=\"$TID\""
The edge answers what it does not route, what it refuses and what it will not negotiate:
curl -s --cacert $CA -o /dev/null -w '%{http_code}\n' https://localhost:8350/q/health/ready
curl -s --cacert $CA --tls-max 1.2 -o /dev/null https://localhost:8350/graphql; echo curl=$?
curl -s -o /dev/null -w '%{http_code}\n' -d x http://localhost:8350/graphql
404
curl=35
400
The first is the edge’s 404 for a path it does not route. The second is the failed handshake of a TLS 1.2 client, curl’s exit code 35. The third is nginx’s answer to plain HTTP on a TLS listener, 400. Read the limits back from the engine, and stop the tier when done:
docker inspect -f '{{.HostConfig.Memory}} {{.HostConfig.NanoCpus}} {{.HostConfig.RestartPolicy.Name}}' ch25-compose-quarkus
docker compose -f examples/25-docker-compose/compose.yaml down -v
805306368 1000000000 unless-stopped
bash examples/25-docker-compose/verify.sh runs the whole sequence on both stacks and prints PASS only when every case holds. The values it asserts:
| Check | Quarkus | Python |
|---|---|---|
| services | edge, quarkus, python, lgtm all healthy |
the same |
| published ports | none on the stack; the edge publishes 8350 and 8351; lgtm on 127.0.0.1 only |
the same |
docker compose port, HostConfig.PortBindings |
no host binding, none declared | the same |
backend network |
Internal is true |
the same |
TrackCargo for ABC123 |
ONBOARD_CARRIER, no errors |
the same |
FanOut source calls, read inside the container |
8 | 6 |
cargos(first: 10) |
6 edges, 6 errors with SERVICE_UNAVAILABLE |
6 edges, 1 error at edges[5].node |
/debug/source-calls, /q/health/ready, /health/ready, / through the edge |
404 |
404 |
| TLS | a TLS 1.2 client fails; no CA fails; plain HTTP answers 400 |
the same |
| 100 KB body | 413, no source call |
413, no source call |
| inside the network | /q/health/started, ready, live answer 200 UP |
/health/live, ready answer 200 UP |
| the key | a file in the edge; in no environment, inspect output or image |
the same |
| limits | 805306368 bytes, 1000000000 nano-CPUs |
402653184, 500000000 |
| policies | unless-stopped, local, 10m by 3, stop timeout 15 |
the same |
| restart | not exercised | one restart after the process exits, healthy again |
| stop with a request in flight | the FanOut completes; exit code 143 within 15 s |
not exercised |
extensions.traceId |
equals the id sent through the edge; the trace is in Tempo and the record in Loki | the same |
| schema | conforms; finalArrivalDate deprecated |
the same |
Decision
Running the whole tier is where the operational and security cost axis of Chapter 2 is paid. The edge terminates TLS 1.3, refuses a body over 64k and routes one path, so those rules live in one place for both stacks and the backends stay off the host. The client diversity and shape variance axis is why the edge forwards traceparent unchanged: any caller can start the trace that an operator reads. The aggregation across sources axis is why the tier ships its own observability backend and a start order that waits for it. The contract and evolution style axis is untouched, since nothing here changes a field. The tracking view therefore runs as an edge, two stacks built once into tagged images and an observability backend, with configuration and the key kept outside the images, health that orders the start, limits and policies the engine confirms, and a trace id that survives from the client to the log record.
Where this goes next
This chapter ran the tracking view as one local tier: an nginx edge with TLS 1.3, a body limit and one route, an internal backend network, a config and two secrets mounted as files, health-ordered start, limits, restart and shutdown settings the engine confirms, and a trace followed from the edge to Tempo and Loki.
Chapter 26 runs the same two images on Kubernetes. The edge, its configuration and its secret become a Deployment, a ConfigMap and a Secret, the health endpoints become probes, and the limits become resource requests and limits. For the specifications and guides, read the Docker Compose documentation’s “Compose file reference” sections on services, configs, secrets and networks, and Docker’s “Restart policies” and “Configure logging drivers” pages. The nginx documentation covers ngx_http_ssl_module, client_max_body_size, proxy_pass and “WebSocket proxying”. On the application side read the Quarkus guides “SmallRye Health” and “Configuring your application”, Uvicorn’s “Settings”, FastAPI’s “Lifespan Events” and the Twelve-Factor App sections “Config” and “Disposability”.