Debugging GraphQL
Diagnosing a GraphQL service from the outside in: reading an error path and the null it caused, a trace id in every execution error, the way from that id to the trace, the log record and the data, an application debug category switched at run time, development surfaces that production never serves, and a trace read for fan-out.
A GraphQL problem report arrives as a response that looks fine from the transport’s side: status 200, a data object with a hole in it, and an error that says little. Chapter 4 explained how a null travels, Chapter 9 explained why the message of an unexpected error is hidden, and Chapter 19 put every request into a trace. This chapter uses all three to find a fault in the application itself: its data, its resolvers and its own code paths.
The code is in examples/24-debugging/. It starts from the Chapter 19 example and serves the same schema, so the SDL does not change. Three things are new. The seed holds a seventh cargo, JKL012, whose route ends at a location code the location service does not hold. Every execution error now carries extensions.traceId. And each stack runs twice: a production instance beside a development instance, so the surfaces a developer uses can be compared with the ones an operator ships. verify.sh follows the fault from the response to its cause on both stacks.
Start from the response
The seeded fault produces two failures through ordinary queries. Call them F1 and F2. F1 asks for the places the cargo’s route unloads:
query LegsOfJkl($id: TrackingId!) {
  cargo(trackingId: $id) {
    trackingId
    itinerary { legs { unloadLocation { name } } }
  }
}
The response holds data.cargo.trackingId as JKL012, a null itinerary and one error whose path is ["cargo","itinerary","legs",1,"unloadLocation"]. Everything needed to place the failure is already there. The path names the field that failed: the second leg’s unloadLocation. The schema says that field is Location!, so the null could not stay where it was and moved up to the nearest nullable ancestor, which is itinerary. That is Chapter 4’s bubbling, applied to a failure in a running service instead of a diagram. The first leg is gone with the rest of the itinerary even though its own locations resolved.
The path is where the error was raised, not where the null landed. A reader who looks at the null itinerary and then at the itinerary resolver is looking in the wrong place; the path points one level lower and two fields deeper. The first habit of debugging GraphQL is to read the path before reading any code.
The path only exists for an execution error, so the first question is which kind of error the response holds. A request error, a document that failed to parse, validate or coerce its variables, has locations and no path, and data is absent on Quarkus and null on Python. Nothing executed and no source was called, so the fix is in the document or in the client that built it. An execution error has a path and sits beside whatever data the rest of the operation produced. Chapter 9 draws the line; a debugging session starts by drawing it again for this response.
The message is the stacks’ own to word. Quarkus answers with the engine’s explanation that the field “was declared as a non null type” and returned a null, with the path in the text. Python answers Internal server error., because the null is an engine error raised from inside a resolver and Chapter 9’s rule masks every execution error that is not an exposed one. Both are correct, and both leave the cause out: the response says which field failed and not why XXBAD is unknown. A client can report the path. Only the server side can say more.
When the response says only “Internal server error.”
F2 asks for the delivery state of the same cargo:
query DeliveryOfJkl($id: TrackingId!) {
  cargo(trackingId: $id) {
    trackingId
    delivery { transportStatus }
  }
}
Cargo.delivery is Delivery!, so a failure inside it nulls the whole cargo. The error has the path ["cargo","delivery"], the message Internal server error. and nothing else of use, which is Chapter 9’s masking doing its job. An unexpected exception has a class name, a message and a stack, and any of those can teach a caller about the internals. The response gives none of them.
An operator still has to find the exception, and the client’s report has to carry something that leads to it. That something is the trace id. Every execution error in this example carries extensions.traceId: the trace id of the request, which is the one the caller sent in traceparent when it sent one, and a new one when it did not. A masked error keeps nothing else. On Quarkus its extensions are code, which is null for an unclassified failure, and traceId. On Python they are traceId alone.
The id is not a secret. It identifies a trace, and reading the trace takes access to the observability backend, so handing it to the client discloses nothing about the failure. It is what a support ticket should quote.
The two stacks add the key through the seam each one provides for it:
public class TraceIdExtensionProvider implements ErrorExtensionProvider {
    @Override
    public String getKey() {
        return "traceId";
    }

    @Override
    public JsonValue mapValueFrom(Throwable exception) {
        SpanContext context = Span.current().getSpanContext();
        return context.isValid() ? Json.createValue(context.getTraceId()) : null;
    }
}
class TraceIdExtension(SchemaExtension):
    def on_operation(self) -> Generator[None]:
        yield
        errors = getattr(self.execution_context.result, "errors", None)
        context = trace.get_current_span().get_span_context()
        if not errors or not context.is_valid:
            return
        trace_id = trace.format_trace_id(context.trace_id)
        for error in errors:
            if error.path:
                error.extensions = {**(error.extensions or {}), "traceId": trace_id}
SmallRye asks each registered ErrorExtensionProvider for its value when it serializes an error, and quarkus.smallrye-graphql.error-extension-fields=code,traceId names the keys that reach the response. The provider is listed in the ServiceLoader file beside the one that writes code. A second seam covers the errors the engine raises itself, such as F1’s null: a graphql-java instrumentation adds the same key to them on the finished result.
Strawberry’s on_operation hook wraps the whole operation, and extensions leave in reverse order of the list. The schema lists TraceIdExtension before MaskErrors, so its exit runs after the masking has rebuilt each masked error, and the key survives. Request errors, a parse or validation failure, have no path and are left as the engine wrote them.
From the trace id to the cause
Figure 24.1 follows F2 on the Python stack. The response gives an id; the id opens the trace, the log record and finally the data.
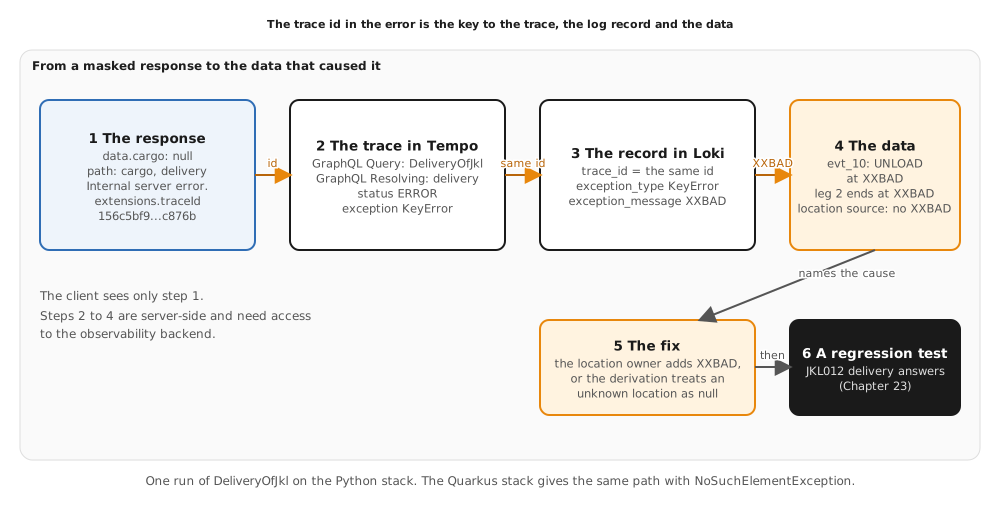
Tempo answers a trace by id. The operation span GraphQL Query: DeliveryOfJkl (Quarkus names it query DeliveryOfJkl) is the root of the request’s work, and below it one resolver span ends in status ERROR: delivery. That span carries an exception event with the exception type and message, so the trace already says which resolver failed and with what. Quarkus marks the operation span ERROR as well, and Python leaves it UNSET; the resolver span is in ERROR on both, so it is the place to look.
The log record gives the detail the span summarizes. Loki holds the record the server wrote when the exception passed through the engine, with the trace id as structured metadata:
{service_name="ch24-debugging-python"} | trace_id="<the id from the response>" | exception_type="KeyError"
The record’s exception_type is KeyError on Python and java.util.NoSuchElementException on Quarkus, and exception_message holds XXBAD on one and no location XXBAD on the other. The derivation looks up the location of the cargo’s last handling event, and the lookup failed on a code it was never given. Both exceptions are the same statement in the two languages: this location is not in the reference data.
Now the data can be read with a question instead of a guess. The handling event evt_10 records an UNLOAD of JKL012 at XXBAD, and the cargo’s second leg ends there. F1 failed for the same reason at a different field: the location source answers null for XXBAD, and Leg.unloadLocation promises a value. One missing reference explains both failures, which a reader of either error alone would not have known.
The example stops at the diagnosis. The derivation is the application’s own code, and the example leaves it unchanged so the fault stays reproducible. There are two repairs. The location owner adds XXBAD, which fixes the data. Or the derivation treats an unknown location as lastKnownLocation: null, which the schema already allows because that field is nullable, and which turns a masked failure into a degraded answer. Chapter 23 supplies the last step: the fix is not finished until a test reproduces JKL012 and keeps it answered.
The application’s debug category
A trace and a log record say what failed. The next question is often what the application looked up on the way. For that the application has a logger of its own, com.patterncatalyst.shipping.tracking.resolve on Quarkus and app.resolve on Python, off by default at INFO. At DEBUG each reference resolver writes one line when its bulk read returns:
resolve Leg.unloadLocation key=DEHAM outcome=found
resolve Leg.unloadLocation key=XXBAD outcome=missing
The line names the field coordinate, the key the resolver asked for and whether the owner had it. It is the missing piece for F1: the response names the field, and the debug line names the key. The line is written after the bulk read returns, by the resolver that maps keys to results, so it reports an outcome and not an intention. Quarkus writes one line per distinct key of a batch, and Python one per resolver call, so a key shared by several legs appears once per leg there. For F1 both stacks write exactly one line for XXBAD. The line carries reference keys, a UN/LOCODE or a voyage number, and never a tracking id, a variable value or a token, which is Chapter 19’s rule for telemetry applied to logs.
static <T> void batch(String coordinate, List<String> keys, List<Outcome<T>> outcomes) {
    if (!LOG.isDebugEnabled()) {
        return;
    }
    Set<String> seen = new HashSet<>();
    for (int i = 0; i < keys.size(); i++) {
        Outcome<T> outcome = outcomes.get(i);
        if (outcome.failure() == null && seen.add(keys.get(i))) {
            LOG.debugf(
                    "resolve %s key=%s outcome=%s", coordinate, keys.get(i), outcome.value() == null ? "missing" : "found");
        }
    }
}
def record(coordinate: str, key: str, value: object | None) -> None:
    """One debug line for a reference the resolver looked up."""
    _LOG.debug("resolve %s key=%s outcome=%s", coordinate, key, "missing" if value is None else "found")
A debug category is only useful if it can be turned on without a restart. A restart clears the state a production fault lives in, and the fault may not come back. Both stacks change a level on the running process:
- Quarkus uses
quarkus-logging-manager.POST /q/logging-managerwith the form fieldsloggerNameandloggerLevelsets the level, andGET /q/logging-manager?loggerName=...reads it back. - Python uses the standard library’s
Logger.setLevel, behind a lab route with the same fields,POST /debug/loggersandGET /debug/loggers?loggerName=....
Both answer 201 to a change and {"name": ..., "effectiveLevel": ...} to a read. Both are served only when TRACKING_DEBUG_ENDPOINTS=true, as the source-call log is: a route that changes log levels is an administrative surface, and an instance that serves the public does not carry it. The example’s compose file sets it on all four instances so that verify.sh can drive the switch; a deployment leaves it unset, and both routes then answer 404. On Quarkus the property quarkus.logging-manager.enable takes its value from the same setting.
The working sequence is a loop. Read the level, raise it, reproduce the failure once, read the lines, lower it again. verify.sh runs the loop on both stacks: INFO, then DEBUG with exactly one key=XXBAD outcome=missing line for the F1 request, then INFO with no further lines.
The debug lines are log records like the exception record, so they reach Loki with the request’s trace id too. A query by the id shows the lines of one request and no other, which is how verify.sh isolates them. The Quarkus console format carries the id as well, traceId=%X{traceId}, so a line in a terminal can be matched to a response.
Development surfaces
A developer needs more than a log. Quarkus dev mode, started with mvn quarkus:dev, recompiles on a change and serves two pages: the Dev UI at /q/dev-ui, which lists the extensions, configuration and endpoints, and the GraphQL UI at /q/graphql-ui, a GraphiQL page wired to the schema. The dev profile also sets quarkus.smallrye-graphql.log-payload=queryOnly, which writes each document into the log:
Payload In [query LegsOfJkl($id: TrackingId!) { cargo(trackingId: $id) { trackingId itinerary { legs { unloadLocation { name } } } } }]
Strawberry serves GraphiQL on the GraphQL path itself. GraphQLRouter takes graphql_ide, and the example sets it from a new TRACKING_PROFILE setting:
GraphQLRouter(
    schema,
    context_getter=get_context,
    graphql_ide="graphiql" if settings.profile == "dev" else None,
)
A production build carries none of this. The GraphQL UI and the Dev UI are part of dev and test mode and not of a production build, and the Python production instance sets graphql_ide=None, the rule of Chapter 17. Figure 24.2 sets the two profiles side by side.
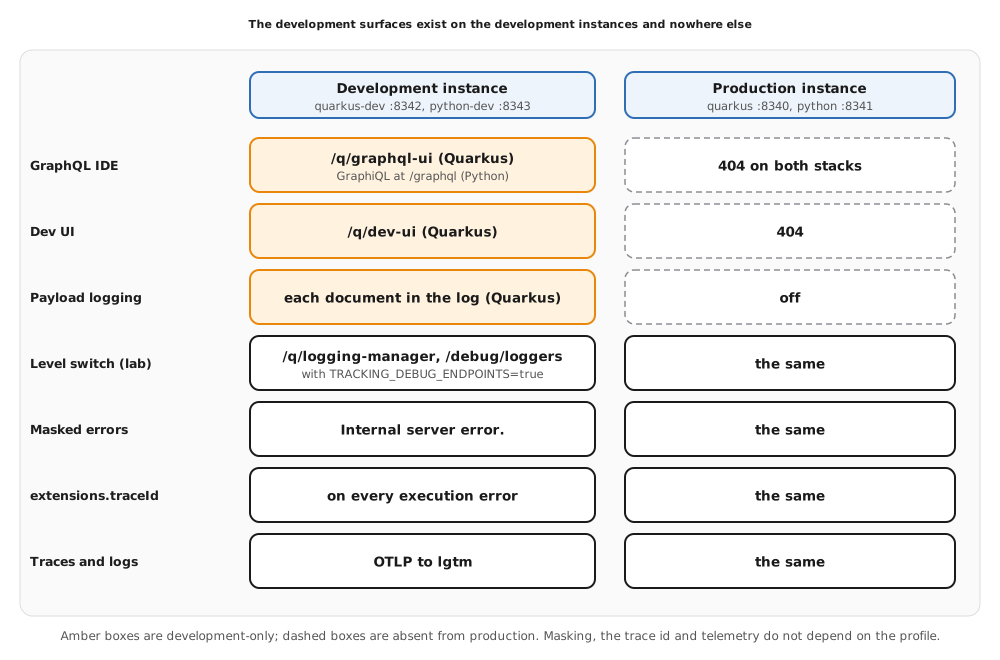
The two profiles differ in what they offer a developer and not in what they promise a client. Masking is identical, extensions.traceId is identical, and both export to the same backend. A development instance must not be easier to read than production in any way a client could depend on, or a fault that reproduces in one will not reproduce in the other.
Dev mode in a container takes three settings. Dev mode starts backing containers, called Dev Services, for the extensions that have one, here an LGTM stack for OpenTelemetry. This instance exports to the compose lgtm service instead, so the dev profile sets %dev.quarkus.devservices.enabled=false. The dev target of the Containerfile also passes -Dquarkus.console.enabled=false, since the container has no terminal, and -Ddebug=false, since no debugger port is published.
Reproducing in a development instance
A fault found in production is reproduced in development with the same document and the same variables. Paste F1 into the GraphQL UI on port 8342 or into GraphiQL on port 8343 and the response has the same error path and the same nulls as the production instance, because the data and the schema are the same. The development instance adds what production withholds: the Quarkus log shows the document as received, and the debug category can stay at DEBUG.
That is the reason the two instances share data and code rather than mocks. A development instance that differs in anything but the surfaces is a second system to debug. When the fix is a code change, dev mode applies it on the next request, and the same document answers differently. The example’s verify.sh runs F1 and F2 against both development instances and asserts the same paths and messages as production.
Reading a trace for fan-out
Chapter 19 read the fan-out trace for time. Debugging reads it for count. The FanOut query pages four cargos with their itineraries and delivery, and on Quarkus its trace holds eight source.call spans, two of them getLocations; on Python six, one of them getLocations. Eight location resolver spans share those calls. The number of getLocations spans in the trace equals the number of location calls in the source-call log for the same request, which verify.sh asserts, so the trace and the log agree.
That agreement is a diagnostic. An N+1 is a call per parent where the batch should have made one, and in a trace it is a row of source.call spans with the same operation at the same level, one beside every resolver span that triggered it. Chapter 13 counted such calls with the log. In a deployed service there is no log of source calls, and the trace is the only place the count is visible.
Across a gateway the same count reads the query plan. The number of requests each subgraph receives for one operation, which Chapter 20 counts, says whether the plan batched a lookup or repeated it. The method is the one used here: pick the trace by id, count the spans of one kind per level.
Debugging with a debugger
A trace and a log answer what happened. A debugger answers why a particular value was what it was, by stopping at the line. Quarkus dev mode opens a JDWP debug port, 5005 by default, on the machine where dev mode runs, and any IDE attaches to it. The container in this example turns it off, so nothing publishes a debug port. A Python service runs under debugpy or an IDE run configuration the same way, on a developer’s machine and never on a shared instance.
Breakpoints have a cost that observation does not. Stopping a request stops its sources, its timeouts and its peers’ view of it, and a fault that depends on timing, such as a batch window, can disappear under a debugger. Use observation first, and the debugger for the one value that observation could not explain.
A checklist
- The response. Does the error have a path? Without one, the request was rejected before execution and the fix is in the client. With one, read the error paths.
- The path and the code. Which field failed, which nullable ancestor became null, and is the code one the service declared?
- The trace id. Take
extensions.traceId, or thetraceparentthe client sent. - The trace. Find the resolver span in
ERROR, and read the exception type and the source calls under it. - The log. Query Loki by the same id. The record holds the exception message and the data in it.
- The data or the code. Turn the debug category on, reproduce once, read the keys, and turn it off.
- The test. Reproduce the fault in a development instance, fix it, and keep a test that fails without the fix, as Chapter 23 builds.
On the wire
Start the stack. Production Quarkus is on 8340, production Python on 8341, their development instances on 8342 and 8343, and Grafana, Tempo, Prometheus and Loki on 8344 to 8347.
docker compose -f examples/24-debugging/compose.yaml up -d --build
curl -s localhost:8341/graphql -H 'Content-Type: application/json' \
  -d '{"query":"query LegsOfJkl($id: TrackingId!) { cargo(trackingId: $id) { trackingId itinerary { legs { unloadLocation { name } } } } }","variables":{"id":"JKL012"}}'
{"data":{"cargo":{"trackingId":"JKL012","itinerary":null}},"errors":[{"message":"Internal server error.","locations":[{"line":1,"column":92}],"path":["cargo","itinerary","legs",1,"unloadLocation"],"extensions":{"traceId":"9d22ab8bbd0fb356a9ae5598548455d9"}}]}
Send F2 under a trace id of your own, and read the response and the trace:
TID=$(python3 -I -c 'import secrets; print(secrets.token_hex(16))')
curl -s localhost:8341/graphql -H 'Content-Type: application/json' \
  -H "traceparent: 00-$TID-00f067aa0ba902b7-01" \
  -d '{"query":"query DeliveryOfJkl($id: TrackingId!) { cargo(trackingId: $id) { trackingId delivery { transportStatus } } }","variables":{"id":"JKL012"}}'
{"data":{"cargo":null},"errors":[{"message":"Internal server error.","locations":[{"line":1,"column":77}],"path":["cargo","delivery"],"extensions":{"traceId":"156c5bf9e9cc30502aad07ac2cec876b"}}]}
The traceId equals $TID. Ask Tempo for the spans that ended in an error, and Loki for the exception record:
curl -s localhost:8345/api/traces/$TID | python3 -I -c 'import json,sys; d=json.load(sys.stdin); print([s["name"] for b in d["batches"] for ss in b["scopeSpans"] for s in ss["spans"] if s.get("status",{}).get("code")=="STATUS_CODE_ERROR"])'
curl -sG localhost:8347/loki/api/v1/query_range --data-urlencode "query={service_name=\"ch24-debugging-python\"} | trace_id=\"$TID\"" | python3 -I -c 'import json,sys; s=json.load(sys.stdin)["data"]["result"][0]["stream"]; print(s["exception_type"], s["exception_message"])'
['GraphQL Resolving: delivery']
KeyError XXBAD
Switch the debug category on, repeat F1 and read the lines, then switch it off:
curl -s -X POST localhost:8341/debug/loggers -d loggerName=app.resolve -d loggerLevel=DEBUG
curl -s 'localhost:8341/debug/loggers?loggerName=app.resolve'
docker compose -f examples/24-debugging/compose.yaml logs --no-color python | grep 'resolve Leg'
curl -s -X POST localhost:8341/debug/loggers -d loggerName=app.resolve -d loggerLevel=INFO
{"name":"app.resolve","effectiveLevel":"DEBUG","configuredLevel":"DEBUG"}
ch24-debugging-python  | 2026-10-17 03:39:25,748 DEBUG app.resolve: resolve Leg.unloadLocation key=DEHAM outcome=found
ch24-debugging-python  | 2026-10-17 03:39:25,748 DEBUG app.resolve: resolve Leg.unloadLocation key=XXBAD outcome=missing
On Quarkus the switch is POST localhost:8340/q/logging-manager with loggerName=com.patterncatalyst.shipping.tracking.resolve. Check the development surfaces on both profiles:
curl -s -o /dev/null -w '%{http_code}\n' localhost:8342/q/graphql-ui/
curl -s -o /dev/null -w '%{http_code}\n' localhost:8340/q/graphql-ui/
curl -s -o /dev/null -w '%{http_code}\n' -H 'Accept: text/html' localhost:8343/graphql
curl -s -o /dev/null -w '%{http_code}\n' -H 'Accept: text/html' localhost:8341/graphql
200
404
200
404
Stop the stack when done:
docker compose -f examples/24-debugging/compose.yaml down -v
bash examples/24-debugging/verify.sh runs the whole sequence on both stacks and prints PASS only when both hold. The values it asserts are in this table.
| Check | Quarkus | Python |
|---|---|---|
TrackCargo for ABC123 |
ONBOARD_CARRIER, no errors, no extensions |
the same |
FanOut |
Chapter 13’s data, 8 calls, 2 getLocations spans |
the same data, 6 calls, 1 getLocations span |
| F1 path and nulls | ["cargo","itinerary","legs",1,"unloadLocation"], itinerary null |
the same |
| F1 message | the engine’s “declared as a non null type” text | Internal server error. |
| F1 source calls | location.getLocations with key DEHAM+XXBAD |
the same |
| F2 response | data.cargo null, path ["cargo","delivery"], Internal server error. |
the same |
| F2 extensions | code null and traceId |
traceId only |
traceId |
equals the traceparent sent; 32 hex characters when none was sent, and the trace is found by it |
the same |
| F2 trace | query DeliveryOfJkl and a delivery span in ERROR below it |
GraphQL Query: DeliveryOfJkl and a GraphQL Resolving: delivery span in ERROR |
| F2 log record | NoSuchElementException, message contains XXBAD |
KeyError, message contains XXBAD |
| response body | no XXBAD, no exception type, no stack frame |
the same |
| debug category | INFO, DEBUG, INFO; one key=XXBAD outcome=missing line for the F1 request |
the same |
| GraphQL UI, Dev UI | development 200, production 404 | GraphiQL: development 200, production 404 |
| payload logging | development log holds the document; production holds none | not applicable |
| schema | conforms; only Subscription unserved |
the same |
Decision
Debugging is where the operational and security cost axis of Chapter 2 meets the developer: masking keeps the cause out of the response, so the service has to supply a path back to it, and the trace id is that path. The aggregation across sources axis is why the cause is usually data owned by another service, and why a trace that counts source calls per request is a diagnostic tool. The client diversity and shape variance axis is why the error path, which every client can read, is the first tool, and the trace id, which a client can quote, is the second. The contract and evolution style axis is untouched, since the trace id is a response extension and not part of the schema. The tracking view therefore reads the path first, puts the trace id in every execution error, finds the trace and the log record by that id, switches an application debug category at run time, keeps the IDE and the Dev UI to development instances, and turns each fault into a test.
Where this goes next
This chapter took one fault from a masked response to the data behind it: a path read for the field and the null, a trace id in every execution error, the trace and the log record found by that id, a debug category switched at run time, development surfaces kept off the production instances, and a trace read for fan-out.
Chapter 25 runs the stack locally with Docker Compose, so the diagnosis path of this chapter has a full environment to work against instead of one example at a time. For the specifications and guides, read the GraphQL specification’s sections “Handling Field Errors” and “Errors”, the W3C Trace Context recommendation and the OpenTelemetry “Trace Context” overview. The Quarkus guides “Dev UI”, “Maven tooling” (dev mode and the debug port), “Configuring logging” and “SmallRye GraphQL” cover the Java side, with the Quarkiverse Logging Manager documentation for the run-time level. Strawberry’s “GraphQL IDE” and FastAPI integration pages, the Python logging documentation’s “Logger Objects” and the Grafana Tempo and Loki documentation cover the rest.