Appendix: running on OpenShift Local (CRC)
The seven Quarkus services, Kafka, Postgres and Apicurio on OpenShift Local, then the platform tier: Service Mesh 3 with a canary, the Custom Metrics Autoscaler, OpenTelemetry tracing, the AI services, a native build and GitOps, all built and verified inside the cluster, with a teardown that leaves it clean.
Chapter 2 put the
mesh on minikube: Docker Engine, containerd, NodePorts published on
127.0.0.1, and images loaded straight into the node. That is a real
Kubernetes deployment, but OpenShift is not plain Kubernetes. It refuses a
pod that asks for a fixed UID, it exposes services through Routes rather
than NodePorts, it ships its own image registry and build system, and it
installs operators through OperatorHub. A chart that runs on OpenShift has
to be built around those four things.
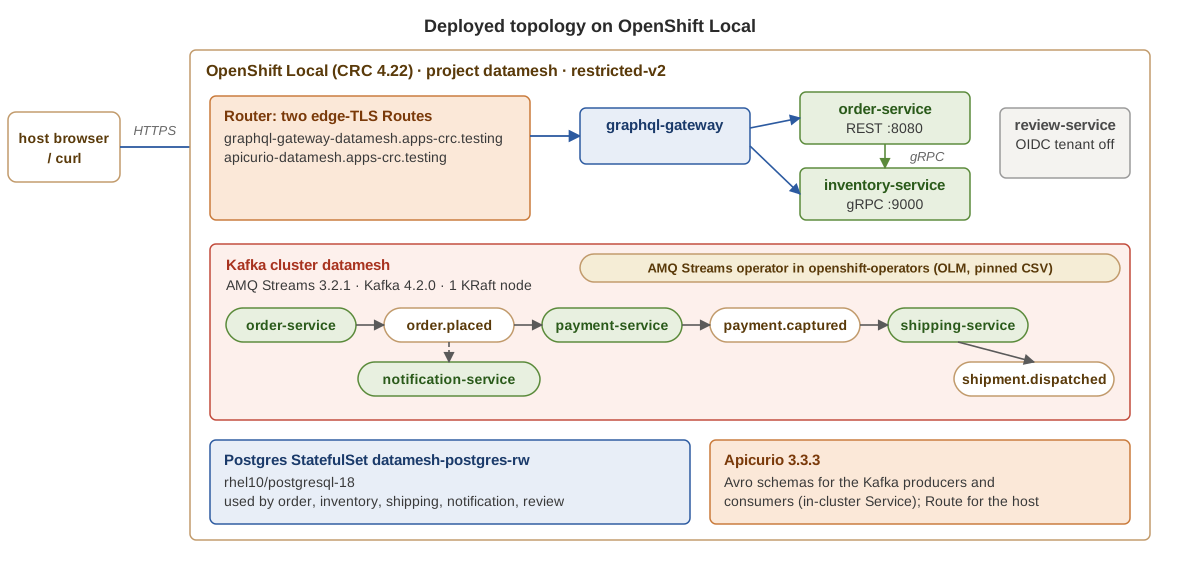
This appendix runs the core of the mesh on OpenShift Local (CRC), a single-node OpenShift 4.22 cluster in a local VM. The core is the seven Quarkus services (order, inventory, payment, shipping, notification, review and the GraphQL gateway) plus Kafka, Postgres and Apicurio. It is optional: nothing else in the tutorial depends on it, and it is the Red Hat counterpart to the minikube path rather than a replacement for it.
Everything lives under openshift/:
the core scripts, openshift/platform/ for the platform tier, and one Helm
chart. The decisions behind them are DRQ-018 to DRQ-028 in
_plans/decisions.md.
Scope
The appendix has two tiers. The core is everything a plain
helm upgrade --install of the chart deploys. The platform tier adds the
rest of the stack the minikube chapters use, one opt-in script at a time.
| Core | Platform tier (openshift/platform/) |
|---|---|
| The 7 services, built in the cluster | Service mesh: OpenShift Service Mesh 3, Kiali, the order-service canary |
| Kafka via the AMQ Streams operator | Autoscaling: the Custom Metrics Autoscaler (Red Hat’s KEDA) |
| PostgreSQL 18 and Apicurio 3.3.3 | Tracing: the Red Hat build of OpenTelemetry and grafana/otel-lgtm |
| Routes, health, GraphQL, the Kafka choreography | The AI services: Ollama, classification, rules triage, MCP |
| A native order-service, compiled inside the cluster | |
| GitOps: OpenShift GitOps (Argo CD) owning the release |
Every platform feature is a chart flag that defaults to false, so the core
renders exactly as it did without them.
Prerequisites
Supported hosts are Fedora or RHEL, on bare metal or in a VM with nested virtualisation. You need:
- OpenShift Local 2.64 (
crc) and a pull secret from a free Red Hat Developer account. The pull secret lets the cluster pull fromregistry.redhat.io, which the Postgres image needs. oc, whichcrcships:eval "$(crc oc-env)"puts it onPATH.helm,jq, and Maven 3.9 with JDK 25, the same toolchain the rest of the tutorial uses.
You do not need a container engine. The images are built inside the cluster.
Size the VM before its first start. The core was verified with 6 vCPUs and 20 GiB; the platform tier needs 12 vCPUs and 32 GiB (Ollama alone requests 4 GiB, and the native build pod up to 8 GiB). The disk is 80 GB either way:
crc config set cpus 12        # 6 for the core only
crc config set memory 32768   # 20480 for the core only
crc config set disk-size 80
crc setup
crc start --pull-secret-file ~/pull-secret.txt
eval "$(crc oc-env)"
Run one cluster at a time: stop the minikube profile first
(minikube stop -p datamesh). Two clusters on one host compete for memory.
No password in any script
crc start prints the kubeadmin password. You do not need it. crc start
also writes a crc-admin context into your kubeconfig, and every script in
openshift/ switches to that context through require_crc in openshift/lib.sh:
oc config use-context "$OCP_CONTEXT" >/dev/null 2>&1 \
    || fail "kubeconfig context $OCP_CONTEXT not found (crc start writes it)"
api="$(oc whoami --show-server 2>/dev/null)" || fail "cannot reach the OpenShift API"
[[ "$api" == *api.crc.testing* ]] || fail "context $OCP_CONTEXT points at $api, not OpenShift Local"
The last check makes the scripts refuse any cluster other than OpenShift Local, so a stale context cannot point them at something else.
What changes on OpenShift
| minikube (Chapter 2) | OpenShift Local | |
|---|---|---|
| Images | docker build, then minikube image load |
quarkus-openshift binary S2I build in the cluster |
| Base image | ubi10/openjdk-25 + -runtime, multi-stage Containerfile |
ubi10/openjdk-25:1.24-15 S2I builder |
| Host access | NodePorts published on 127.0.0.1 |
Edge-TLS Routes on *.apps-crc.testing |
| Kafka | Strimzi 1.2.0 via Helm, Kafka 4.3.1 | AMQ Streams 3.2.1 via OperatorHub, Kafka 4.2.0 |
| Postgres | CloudNativePG, PostgreSQL 18.6 | StatefulSet, rhel10/postgresql-18 |
| Pod identity | runAsUser: 185 |
restricted-v2 assigns a UID from the namespace range |
The env contract does not change. The chart’s ConfigMap carries the same
keys as k8s/base/config.yaml (KAFKA_BOOTSTRAP_SERVERS,
APICURIO_REGISTRY_URL, JDBC_URL, INVENTORY_GRPC_HOST/PORT), and the
Service and Secret names match minikube’s (datamesh-kafka-bootstrap,
datamesh-postgres-rw, datamesh-postgres-app). The services’ %prod
configuration works as it is, and no application.properties file changes.
restricted-v2 picks the UID
The minikube manifests pin runAsUser: 185, the UID the UBI OpenJDK images
use. On OpenShift the default SCC, restricted-v2, rejects a pod that asks
for a UID outside the namespace’s range. The chart therefore sets no
runAsUser at all, only what restricted-v2 requires:
securityContext:
  runAsNonRoot: true
  allowPrivilegeEscalation: false
  capabilities:
    drop: ["ALL"]
  seccompProfile:
    type: RuntimeDefault
On the verified run every pod, including Kafka and Postgres, ran under
restricted-v2 with UID 1000700000, the first UID in that project’s range
1000700000/10000. Every image used here tolerates an arbitrary UID: the UBI
OpenJDK image, the Red Hat Postgres image and Apicurio.
Routes instead of NodePorts
The chart creates two Routes, both edge-terminated with HTTP redirected to HTTPS:
| Route | Host |
|---|---|
graphql-gateway |
graphql-gateway-datamesh.apps-crc.testing |
apicurio |
apicurio-datamesh.apps-crc.testing |
crc setup makes *.apps-crc.testing resolve on the host. The router’s
certificate is signed by the cluster’s own ingress CA, so the evidence script
fetches that CA and passes it to curl rather than turning verification off:
oc get configmap default-ingress-cert -n openshift-config-managed \
    -o jsonpath='{.data.ca-bundle\.crt}' > "$CA"
curl --cacert "$CA" "https://graphql-gateway-datamesh.apps-crc.testing/q/health/ready"
The other services have no Route. The verification steps that need them
(seeding stock, creating an order) run curl inside the service’s own pod
with oc exec; the UBI OpenJDK image includes curl.
Building the images inside the cluster
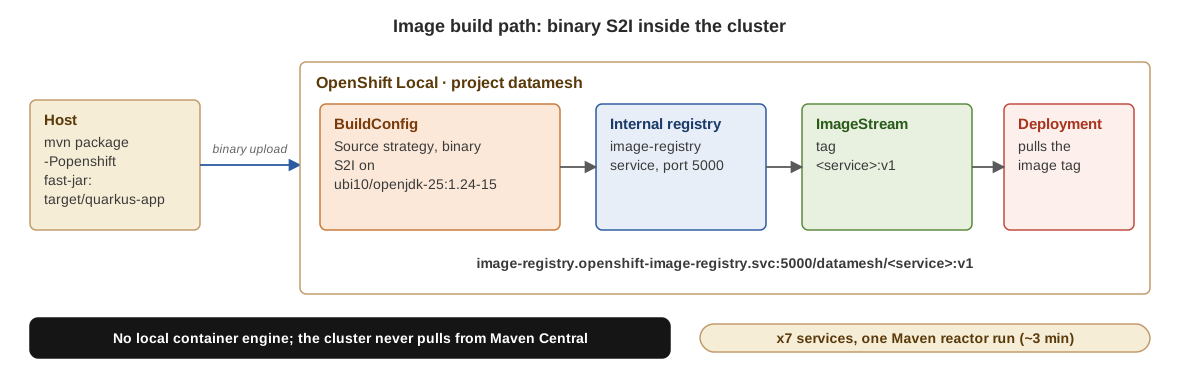
Each service pom has an openshift profile that adds one extension:
<profile>
  <id>openshift</id>
  <dependencies>
    <dependency>
      <groupId>io.quarkus</groupId>
      <artifactId>quarkus-openshift</artifactId>
    </dependency>
  </dependencies>
</profile>
The profile only takes effect with -Popenshift, so mvn verify and the
minikube images are unchanged. openshift/build-images.sh builds all seven
in one Maven reactor run:
mvn -B -q -pl "$modules" -am package -DskipTests -Popenshift \
    -Dquarkus.container-image.build=true \
    -Dquarkus.container-image.tag=v1 \
    -Dquarkus.openshift.version=v1 \
    -Dquarkus.openshift.base-jvm-image=registry.access.redhat.com/ubi10/openjdk-25:1.24-15 \
    -Dquarkus.kubernetes-client.namespace=datamesh \
    -Dquarkus.kubernetes.deploy=false
For each service, Maven builds the fast-jar (target/quarkus-app) on the
host. The extension then creates a BuildConfig (Source strategy, binary
input) and two ImageStreams, and uploads the fast-jar. OpenShift runs the
S2I assemble script of ubi10/openjdk-25 on it inside the cluster and pushes
the result to the internal registry as <service>:v1.
quarkus.kubernetes.deploy=false limits the extension to building and
pushing; the Helm chart owns the Deployments.
The cluster never runs Maven and never pulls from Maven Central. The host never runs a container engine. Each in-cluster build took 14 to 20 seconds, and the whole reactor took about three minutes.
Three settings matter, and the run below found each the hard way:
quarkus-openshift, notquarkus-container-image-openshift. The container-image extension alone builds nothing. It logsNo OpenShift manifests were generated so no OpenShift build process will be taking place, because the BuildConfig and ImageStreams come from the manifest generator inquarkus-openshift.quarkus.openshift.versionsets the tag. With onlyquarkus.container-image.tag=v1, the BuildConfig’s output stayed atorder-service:1.0.0-SNAPSHOT, the project version. The OpenShift manifest generator takes the output tag fromquarkus.openshift.version.- The base image. The extension’s default is
ubi9/openjdk-25:1.24. This project uses UBI 10 everywhere, so the profile overrides it with a pinned tag that carries the S2I labels (io.openshift.s2i.scripts-url=image:///usr/libexec/s2i).
The S2I image starts the app differently
The minikube image’s Containerfile ends with
ENTRYPOINT ["java", "-jar", "quarkus-run.jar"] and sets
JAVA_TOOL_OPTIONS itself. The S2I image instead starts the app with
run-java.sh, which never reads that Containerfile. The chart therefore
supplies two things the Containerfile used to:
- The Avro allow-list. Avro 1.12 refuses to deserialise classes outside
org.apache.avro.SERIALIZABLE_PACKAGES(Chapter 17), so each Kafka service gets its packages asJAVA_TOOL_OPTIONS(avroPackagesinvalues.yaml). - Heap sizing.
run-java.shsets-XX:MaxRAMPercentagefromJAVA_MAX_MEM_RATIO, and the default is 80. At 80% of a 640 MiB limit, metaspace, threads and Netty buffers have little room left, so the chart sets 50. The variable isJAVA_MAX_MEM_RATIO; the image ignoresJAVA_MAX_RAM_RATIO.
Kafka from OperatorHub
openshift/install-infra.sh installs AMQ Streams, Red Hat’s build of
Strimzi, through OLM, then creates the Kafka cluster.
The Subscription pins one version. With installPlanApproval: Manual and a
startingCSV, OLM proposes exactly that CSV, and the script approves only
the InstallPlan that names it:
spec:
  name: amq-streams
  source: redhat-operators
  sourceNamespace: openshift-marketplace
  channel: amq-streams-3.2.x
  startingCSV: amqstreams.v3.2.1-14
  installPlanApproval: Manual
It goes into openshift-operators, where the default global-operators
OperatorGroup makes it watch every namespace.
One timing quirk: just after crc start, the redhat-operators catalog
reports READY while serving no packages for about a minute. The script
therefore waits for the amq-streams packagemanifest itself, not for the
catalog’s status.
The Kafka CR keeps the minikube shape: a cluster named datamesh, one KRaft
node with both roles, and a plain listener on 9092. That keeps the bootstrap
address the services already use. It differs from minikube in three ways:
- it uses the
kafka.strimzi.io/v1API, because AMQ Streams 3.2 warns that v1beta2 is deprecated; - it has no entity operator, so topics auto-create on first use, as in the compose stack;
- it sets explicit resources to fit the 20 GiB VM.
Postgres, Apicurio and the chart
openshift/helm/datamesh uses one data-driven template for all seven
services. values.yaml has a services: map, and each entry declares only
what is specific to that service:
services:
  order-service:
    db: true
    avroPackages: capstone.order.v1
    resources: {requests: {cpu: 150m, memory: 320Mi}, limits: {cpu: 750m, memory: 640Mi}}
  inventory-service:
    db: true
    grpcPort: 9000
  review-service:
    db: true
    env:
      QUARKUS_OIDC_TENANT_ENABLED: "false"
  graphql-gateway:
    env:
      ORDER_SERVICE_URL: http://order-service:8080
The full map also sets resources for every service. In the template:
db: truemounts the Postgres credentials and adds await-for-postgresinit container;grpcPortadds a container port and a Service port;avroPackagesbecomesJAVA_TOOL_OPTIONS.
Images come from the internal registry
(image-registry.openshift-image-registry.svc:5000/datamesh/<service>:v1).
Postgres is a StatefulSet on
registry.redhat.io/rhel10/postgresql-18:10.2-1791491063, the newest Red Hat
PostgreSQL stream (the verified run below used rhel10/postgresql-16). That image
is designed for arbitrary UIDs, and its probes call the image’s own
/usr/libexec/check-container. Minikube runs PostgreSQL 18.6 under
CloudNativePG, so both now run PostgreSQL 18. The
password is generated by Helm on the first install and kept on upgrades
through lookup. It never appears in values.yaml, a file or the evidence.
Apicurio is quay.io/apicurio/apicurio-registry:3.3.3 with in-memory
storage, the same version as minikube.
review-service needs one change. It has quarkus-oidc on its classpath
for the authenticated DELETE /reviews/{id} demo, and Dev Services supplies
Keycloak in dev and test. In the prod build no OIDC provider exists, and
startup fails:
'quarkus.oidc.auth-server-url' property must be configured
The chart sets QUARKUS_OIDC_TENANT_ENABLED=false. The service starts,
DELETE /reviews/{id} answers 401, and every other endpoint works (DRQ-022).
Running it
./openshift/install-infra.sh      # project, AMQ Streams, Kafka            ~50 s
./openshift/build-images.sh       # 7 in-cluster builds -> <service>:v1    ~3 min
./openshift/deploy.sh             # helm upgrade --install, wait for rollout ~35 s
./openshift/capture-evidence.sh   # 7 checks -> openshift/evidence/<date>/  ~15 s
deploy.sh checks that Kafka is Ready and all seven ImageStream tags exist.
It then runs helm upgrade --install and waits for oc rollout status on
every Deployment. It waits on rollout status rather than
condition=Available, because on an upgrade the old ReplicaSet stays
Available until the new pods are Ready.
Verifying it
capture-evidence.sh fails on the first check that misses and writes what
it saw to openshift/evidence/<date>/:
- Builds. Seven Complete builds, seven ImageStream tags
v1. - Pods. All Ready, all
restricted-v2, and all UIDs from the namespace range. - Gateway Route.
/q/health/readyanswers 200 over edge TLS. -
GraphQL. One query returns the order from order-service (REST) and its stock from inventory-service (gRPC):
{"order":{"id":"9cded459-…","customerId":"crc-evidence","itemSku":"CRC-WIDGET-7028", "quantity":1,"status":"PLACED", "stock":{"sku":"CRC-WIDGET-7028","quantityOnHand":12,"available":true}}} - Kafka choreography. For the same order ID, payment-service logs the
capture, a row appears in the
shipmenttable, and notification-service lists theorder.placednotification. No service calls another; each one reacts to the event before it (Chapter 13). - Apicurio Route. Three artifacts are registered:
order.placed-value,payment.captured-valueandshipment.dispatched-value. - Secret scrub. The script reads the database password into a shell
variable without printing it. It then fails if that password, an
OpenShift token (
sha256~…) or a private key appears anywhere in the evidence.
One detail in the shipment row can look like a bug. Its SKU and quantity
differ from the order’s, because PaymentCaptured carries no line items, so
shipping-service derives them deterministically from the order ID
(ShipmentProcessor). It behaves the same way on compose and minikube.
What broke on the live run
| Symptom | Cause | Fix |
|---|---|---|
| Maven succeeded in 13 s and no image appeared | quarkus-container-image-openshift alone generates no BuildConfig |
Use quarkus-openshift |
ImageStream tag 1.0.0-SNAPSHOT instead of v1 |
The output tag follows quarkus.openshift.version |
Set -Dquarkus.openshift.version=v1 |
| Heap at 80% of the limit | The image reads JAVA_MAX_MEM_RATIO, not JAVA_MAX_RAM_RATIO |
Rename; set 50 |
| Five services restarted once or twice on install | Hibernate connects at boot, before Postgres accepts connections | A wait-for-postgres init container (bash /dev/tcp, same image, nothing extra pulled) |
| ConfigMap change did not reach running pods | Env from a ConfigMap is read at pod start | A checksum/config annotation on the pod template |
deploy.sh reported success while new pods were starting |
condition=Available was satisfied by the old ReplicaSet |
oc rollout status per Deployment |
| Deprecation warnings on apply | AMQ Streams 3.2 deprecates kafka.strimzi.io/v1beta2 |
Move the CRs to kafka.strimzi.io/v1 |
| review-service would not start | No OIDC provider in prod | QUARKUS_OIDC_TENANT_ENABLED=false |
ScaledObject Ready=False, no such host |
KEDA runs in openshift-keda, where the short Kafka name does not resolve |
Fully qualified bootstrapServers |
Native order-service: SecurityException: Forbidden capstone... on every send |
Avro reads its allow-list during native-image’s build-time initialisation | Pass it with quarkus.native.additional-build-args |
| A request to a pod IP was reset | A pod-IP call leaves the client sidecar as plaintext, and the target is STRICT | Call the Service name |
| (avoided) Postgres password replaced on every Argo CD sync | lookup returns nothing under helm template |
ignoreDifferences on the password plus RespectIgnoreDifferences=true |
After these fixes, a fresh install from an empty cluster comes up with zero restarts.
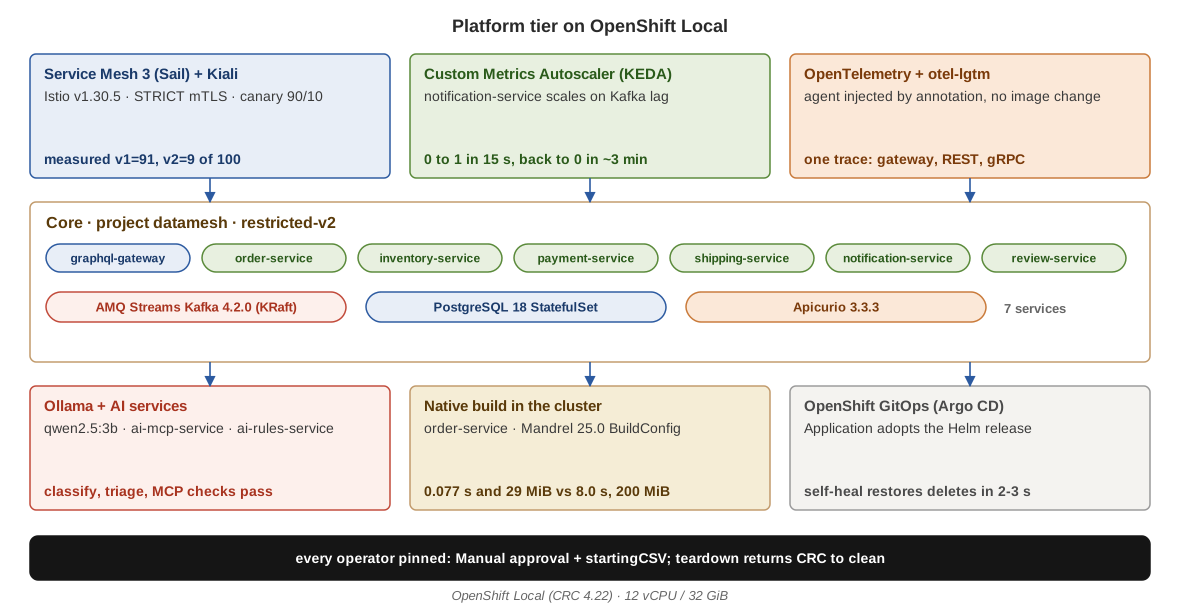
The platform tier
openshift/platform/install-platform.sh runs the six steps below in order,
on top of a deployed core; each step is also its own script. Every operator
goes through the same install_operator helper in openshift/lib.sh that
installs AMQ Streams: a Subscription pinned with startingCSV and
installPlanApproval: Manual, and only the InstallPlan that names that CSV
is approved.
| Operator | CSV | Channel |
|---|---|---|
| OpenShift Service Mesh 3 | servicemeshoperator3.v3.4.3 |
stable-3.4 |
| Kiali | kiali-operator.v2.27.5 |
stable |
| Custom Metrics Autoscaler | custom-metrics-autoscaler.v2.19.0-4 |
stable |
| Red Hat build of OpenTelemetry | opentelemetry-operator.v0.158.0-2 |
stable |
| OpenShift GitOps | openshift-gitops-operator.v1.22.1 |
gitops-1.22 |
capture-evidence.sh detects which features are installed and checks each
one; the results are in openshift/evidence/<date>/11-mesh.txt to
16-gitops.txt.
Service mesh: OpenShift Service Mesh 3
Chapter 6 runs
Istio 1.31.1 from Helm on minikube. OpenShift’s mesh is OSSM 3, built on
the Sail operator: install-mesh.sh creates an IstioCNI and an Istio CR,
both pinned to v1.30.5. OSSM 3.4.3 offers v1.26 to v1.30, so v1.30.5 is the
newest it supports; minikube’s 1.31.1 waits for a newer OSSM. The CRD also accepts v1.30-latest;
that floats, so it is not used.
Pods join the mesh through the istio.io/rev: default label that the
chart’s mesh.enabled flag adds; Sail’s revisioned injection matches
labels. On Kubernetes 1.35 Istio injects istio-proxy as a native sidecar
(an init container that keeps running), ordered before wait-for-postgres,
so that check already goes through the proxy. Kafka, Postgres and Apicurio
stay outside the mesh.
Namespace-wide mTLS is STRICT, with one exception: graphql-gateway is
PERMISSIVE, because the OpenShift router is not in the mesh and the Route
delivers plaintext. Without it every Route request would fail.
install-mesh.sh --canary adds order-service-v2 (the same image, label
version: v2) with a DestinationRule and a 90/10 VirtualService. OSSM 3
provisions no ingress gateway and the edge is already the Route, so the
split applies to mesh-internal calls, which is how the gateway reaches
order-service.
Verified:
- mTLS. A plaintext call from the unmeshed Apicurio pod to order-service is reset (curl exit 56); the same call from the meshed gateway pod answers 200, and the Route still answers 200.
- Canary. Of 100 requests from the gateway, Istio’s own
istio_requests_totalcounters on the two pods counted v1=91, v2=9. - Kiali (anonymous access on this single-user cluster) reports the
namespace
MTLS_ENABLED, and its traffic graph shows all 10 workloads.
The graph needs Prometheus, which OpenShift Local does not run. When the
mesh and tracing are both installed, otel-lgtm’s built-in Prometheus also
scrapes the sidecars’ merged metrics port (15020, which Istio leaves out of
mTLS), and install-observability.sh points Kiali at it.
Autoscaling: the Custom Metrics Autoscaler
Chapter 7 scales
notification-service from zero on Kafka consumer lag with KEDA. On OpenShift
the same API comes from the Custom Metrics Autoscaler: install-keda.sh
installs the operator into openshift-keda, creates a KedaController, and
the chart’s keda.enabled flag adds the same ScaledObject as
k8s/keda/consumer-scaledobject.yaml. The chart also stops setting
replicas on notification-service, so Helm and the HPA do not fight.
One change was needed: the trigger’s bootstrapServers must be the fully
qualified name
(datamesh-kafka-bootstrap.datamesh.svc.cluster.local:9092). KEDA’s
operator runs in openshift-keda, where the short name the services use
does not resolve, and the ScaledObject stayed Ready=False with
no such host until it was qualified.
Verified: idle at 0 replicas, 15 orders scaled it to 1 within 15 seconds,
the lag drained, and the cooldown returned it to 0 three minutes after the
burst. It stops at one replica because the auto-created order.placed topic
has one partition, and KEDA does not scale a consumer group past its
partition count.
The KEDA HTTP add-on that scales the gateway on minikube is not part of the Custom Metrics Autoscaler, so that scaler has no counterpart here.
Tracing: the OpenTelemetry Java agent and otel-lgtm
No service has quarkus-opentelemetry. On compose,
Chapter 8’s tracing demo
attaches the OpenTelemetry Java agent with -javaagent. OpenShift does the
same thing without touching an image: the Red Hat build of OpenTelemetry
operator injects the agent into every pod annotated
instrumentation.opentelemetry.io/inject-java: datamesh-java. The chart’s
observability.enabled flag adds that annotation and an Instrumentation
CR that sends traces to grafana/otel-lgtm:0.36.0, the compose image, which
gets a Grafana Route.
Two details:
- otel-lgtm runs as root, so it uses the
anyuidSCC through its own ServiceAccount, and is the one pod outsiderestricted-v2. ItssecurityContextsetsrunAsUser: 0and nothing else:anyuidallows no seccomp profile, and adding one silently lands the pod back onrestricted-v2, where Grafana cannot write its data directory. - Helm creates the Deployments before the Instrumentation CR, so pods
started in the same upgrade can miss the injection webhook.
install-observability.shrestarts any annotated Deployment whose pod lacks the agent’s init container.
Verified: one GraphQL request through the Route produced a single trace in
Tempo with spans from graphql-gateway, the order-service it called over
REST and inventory-service over gRPC, plus their database queries. The
agent propagates W3C trace context across REST, gRPC and the mesh. Once order-service runs native (below), its spans come only from the JVM
canary, because a native binary cannot load the agent.
The AI services: Ollama, classification, triage and MCP
install-ai.sh builds ai-mcp-service and ai-rules-service in the
cluster like the other seven. The chart’s ai.enabled flag then deploys:
ollama/ollama:0.40.2, the compose profile’s version, with a 10 Gi volume;- a Job that pulls
qwen2.5:3b; - the two services, pointed at it with
QUARKUS_LANGCHAIN4J_OLLAMA_BASE_URL.
Ollama runs under restricted-v2 once HOME and OLLAMA_MODELS point at
the volume. Neither AI service has a health extension, so the chart probes
their HTTP port over TCP.
Verified, with the same inputs and expected answers as the compose demos:
demo-ai-classify.sh’s three orders came back PERISHABLE, HAZARDOUS and FRAGILE;demo-ai-triage.sh’s three orders came back ROUTE_TO_WAREHOUSE, EXPEDITE and FRAUD_HOLD, from both the Camel route (/api/orders/triage) and the Quarkus Flow workflow (/api/orders/triage-flow);demo-ai-mcp.sh’s session listed theorder-statustool and returned SHIPPED for ORD-001.
A native order-service, compiled in the cluster
The host has no native-image and no container engine, so
build-native.sh splits the work:
- The host runs Maven with
-Pnative -Dquarkus.native.sources-only=true. That producestarget/native-sources: the jar, its libraries and anative-image.argsfile. - A Docker-strategy binary build uploads that directory and runs
native-imageinquarkus/ubi10-quarkus-mandrel-builder-image:jdk-25.0.4.1(Mandrel for GraalVM 25.0, the version Quarkus records ingraalvm.version). The binary is copied ontoquarkus/ubi10-quarkus-micro-image:2.0-2026-10-04. - The image is pushed as
order-service-native:v1. The build pod gets 4 to 8 GiB of memory, and the cluster still never contacts Maven Central.
The chart’s native.enabled flag switches order-service to that image, and
native-image took just over two minutes. On the first run, every order
failed to publish:
SRMSG18260: Unable to recover from the serialization failure (topic: order.placed) ...
java.lang.SecurityException: Forbidden capstone...
Avro’s ClassSecurityValidator reads org.apache.avro.SERIALIZABLE_PACKAGES
in a static initializer, and Quarkus initialises that class while
native-image runs. The allow-list therefore has to be in the image
builder’s JVM; the -D the JVM image gets through JAVA_TOOL_OPTIONS
arrives too late for a native binary. build-native.sh passes it at build
time and checks that it reached native-image.args:
-Dquarkus.native.additional-build-args="-J-Dorg.apache.avro.SERIALIZABLE_PACKAGES=capstone.order.v1"
The repository’s demo-native.sh never sends a Kafka message, so this only
showed up here.
Verified: the native order-service started in 0.077 s and used 29 MiB,
against 8.0 s and 200 MiB for the JVM order-service-v2 beside it. The JVM
pod also carries the OpenTelemetry agent; a native binary cannot load a
Java agent, so the native pod is not annotated for injection. An order
placed through the native pod went through payment and shipping.
GitOps: OpenShift GitOps owns the release
install-gitops.sh installs OpenShift GitOps, labels the project
argocd.argoproj.io/managed-by=openshift-gitops, and creates an Argo CD
Application. The Application renders openshift/helm/datamesh from this
repository on GitHub with the values the running release already has, and
adopts its resources. From then on Argo CD keeps the cluster equal to git,
with automated sync, prune and self-heal.
One setting is essential. Argo CD renders charts with helm template, where
Helm’s lookup returns nothing, so the chart would mint a new Postgres
password on every sync. The Application therefore ignores that one field
and tells the sync to respect the ignore:
"ignoreDifferences": [{"kind": "Secret", "name": "datamesh-postgres-app",
                       "jsonPointers": ["/data/password"]}],
"syncOptions": ["RespectIgnoreDifferences=true", "ApplyOutOfSyncOnly=true"]
Verified:
- the Application went Synced and Healthy;
- deleting the
datamesh-app-configConfigMap, a VirtualService, or scaling payment-service to zero was reverted within two to three seconds; - after adoption, a restarted DB service logged in to Postgres with no authentication failure, so the password was untouched.
install-gitops.sh tracks main by default. The verification run tracked
this appendix’s branch before it merged.
Tearing it down
This CRC instance is meant for this workshop alone, so teardown removes everything the other scripts added, not just the Helm release:
./openshift/teardown.sh                  # clean up, then crc stop
./openshift/teardown.sh --keep-running   # clean up, leave CRC running
In order, it does the following:
- deletes the Argo CD Application, whose finalizer prunes what Argo CD manages, so nothing re-creates what follows;
- uninstalls the Helm release while KEDA and OpenTelemetry can still clear their finalizers, then deletes the Kafka cluster while AMQ Streams can;
- deletes the
datameshproject, which takes the builds, ImageStreams and PVCs with it; - deletes the Kiali, Istio, IstioCNI, KedaController and Argo CD instances, again while their operators run;
- for each operator, reads the CRDs its CSV owns, then removes the Subscription, CSV, InstallPlans and those CRDs;
- deletes the CRDs no CSV owns (Istio’s, which the Sail operator creates) and the operator namespaces;
- reports any Subscription, CSV, namespace or platform CRD still left;
- stops CRC, unless
--keep-runningwas given.
The order matters. If the project is deleted first, any KafkaTopic keeps a
strimzi.io/topic-operator finalizer that nothing is left to remove, and
the namespace hangs in Terminating. This happened while this appendix was
prepared, on a namespace left behind by another workshop.
The whole cycle
Two full cycles ran on 2026-10-09, each from an empty cluster and without intervention.
Core only (6 vCPUs, 20 GiB):
| Step | Time |
|---|---|
teardown.sh --keep-running (from a running deployment) |
46 s |
install-infra.sh |
50 s |
build-images.sh |
182 s |
deploy.sh |
33 s |
capture-evidence.sh |
13 s |
Core plus the whole platform tier (12 vCPUs, 32 GiB):
| Step | Time |
|---|---|
teardown.sh --keep-running (from the full platform) |
213 s |
install-infra.sh |
50 s |
build-images.sh |
179 s |
deploy.sh |
33 s |
platform/install-platform.sh |
837 s |
| mesh with canary · autoscaling · tracing · AI | 244 · 42 · 127 · 102 s |
| native build · deploy native · GitOps | 176 · 20 · 125 s |
capture-evidence.sh (all 6 core and 6 platform sections) |
418 s |
teardown.sh (everything, then crc stop) |
266 s |
The capture is long mostly because it waits for KEDA’s cooldown to return notification-service to zero.
Verification status: verified. On 2026-10-09 both cycles above ran on OpenShift Local 2.64.0 (OpenShift 4.22.14, Kubernetes 1.35.6), with Quarkus 3.39.5, rhel10/postgresql-16, Apicurio 3.2.4, otel-lgtm 0.8.1 and Ollama 0.35.1. Later that day the pins moved to Quarkus 3.40.1, rhel10/postgresql-18, Apicurio 3.3.3, otel-lgtm 0.36.0 and Ollama 0.40.2 (DRQ-029); those are not yet re-verified on CRC, and the operator CSV pins are re-checked at the next run.
The core run used AMQ Streams amqstreams.v3.2.1-14, Kafka 4.2.0 and seven in-cluster builds on ubi10/openjdk-25:1.24-15. All pods were Ready under restricted-v2 with zero restarts, the gateway Route was healthy, GraphQL stitched order and stock, the order went through payment and shipping for one order ID, and Apicurio held three artifacts.
The platform run, on the same core, recorded:
- the mesh rejecting plaintext under STRICT mTLS, a 91/9 canary split for 90/10, and Kiali reporting the namespace
MTLS_ENABLEDwith 10 workloads in its graph; - notification-service scaling 0 to 1 to 0;
- one trace across the gateway and inventory-service (the native order-service carries no agent);
- classify, triage and MCP matching the compose demos;
- the native order-service starting in 0.077 s at 29 MiB against 8.0 s and 200 MiB for the JVM pod;
- Argo CD Synced, restoring a deleted ConfigMap in 2 s.
The secret scrub passed, evidence is in openshift/evidence/2026-10-09/, and teardown removed every operator, CRD and namespace, then stopped CRC. Single run of each. Not covered: OpenShift’s own monitoring stack, and Tekton pipelines.